Introduction:
The Department of Energy’s primary energy statistics provision unit is the Energy Information Administration, originally chartered to provide unbiased information on energy production and usage for the U.S. Congress. The separate EIA website further states The U.S. Energy Information Administration (EIA) collects, analyzes, and disseminates independent and impartial energy information to promote sound policy decision-making. Overall, the DOE employed 15,124 people as of July, 2022. Of this total, only about 350-400 personnel work within the Energy Information Administration, according to a recent Congressional Research Service report prepared for Congress.
Article Focus:
This article focuses on the rapidly developing market for large-scale bulk energy storage systems in the United States. Much of the source information for this article has been provided by the DOE’s Energy Information Administration (EIA). The EIA early release of Form EIA-860, Annual Electric Generator Report, issued in July, 2023, is found here: https://www.eia.gov/analysis/studies/electricity/batterystorage/ .
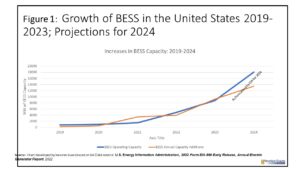
Note in the accompanying chart (Figure 1) the tremendous growth spurt in total MW of BESS capacity over the 2019-2022 years, extending out to the projected new installations now planned for 2023 and 2024. By year-end 2022, nearly nine GW of BESS capacity had been installed in the U.S. Note: Click on each chart to enlarge:
Importantly, BESS usage can be viewed on multiple levels and from various angles. For example, units can be seen by age of the installation, by location of the units, by installed cost based on duration of capacity, by ownership type, whether the BESS units are stand-alone or are co-located with power generation facilities (fossil and renewables), and from a ranking of applications served by the BESS unit.
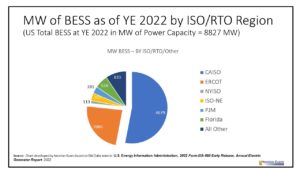
The second chart shown here (Figure 2) portrays the ISO/RTO regional locations of BESS by MW of installed capacity. Note the high proportion of currently installed BESS power capacity that is found within CAISO (53% of the nation’s total at YE 2022), and ERCOT (with about 23% of the nation’s total). The remaining nearly one quarter of installed BESS capacity is shared among five regions (NYISO, ISO-NE, PJM, Florida and “all other areas”).
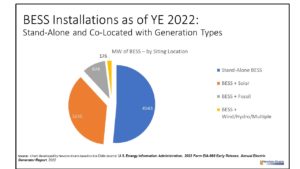
The next chart (Figure 3) illustrates the dominant role of “stand-alone” BESS installations. BESS plus solar sited installations are also significant, amounting to 3,235 MW of capacity. BESS co-located with fossil generation facilities is relatively important, providing 874 MW of capacity. The one surprising observation (to the author) is the relative scarcity of BESS installations co-located with wind farms, hydro and other generating facilities.
As mentioned earlier in this article, there are myriad additional ways to look at BESS installations. In terms of applications used as the basis for installing BESS units, Frequency Regulation was the response having the most MW of capacity (6685), Arbitrage was second (5214 MW), followed by Spinning Reserve or Ramping (4935 MW) and Excess Generation storage (2963 MW). Lower down in BESS installation application rankings included voltage or reactive power support, load management, system peak shaving and load following.
Another approach to segment assessment involves a look at ownership types. IPPs (Independent Power Producers) are responsible for a majority of installed BESS MW of capacity (7232 MW), Electric utilities account for about 1463 MW of installed capacity and C&I firms for most of the remaining installed capacity.
As things look right now, and if supply chains can improve so that the necessary components of battery energy storage systems can continue to be manufactured, assembled and installed to meet market demand levels, the BESS market is destined to continue growing at high double digit levels through much of the remaining 2020’s. By YE 2024 it appears to us that the equivalent of more than 30 GW of BESS power capacity will be installed and operational throughout the United States.


 summary reviews and highlights from completed studies
