Posted on

Estimated Value of Selected OT/IT Systems Shipments and License Fees by U.S. Electric Utilities Now Exceeds $3 billion.

The 2022-2024 edition of the Newton-Evans’ U.S. market overview series covering developments in 12 control and monitoring systems and related IT/OT applications topics is now available for ordering on the company’s website.

The series covers the following topics with individual 2-to-4-page report summaries.  The summaries are based on our studies with utilities and industry discussions held over the past three years.  The market segments covered in this year’s series include energy management systems (EMS), supervisory control and data acquisition (SCADA), geographic information systems (GIS), customer information systems (CIS), outage management systems (OMS), meter data management systems (MDMS), mobile workforce management systems (MWM), advanced distribution management systems and advanced distribution automation (ADMS/ADA), energy market management systems (EMMS), Cyber Security, generation management and distributed control systems (GMS/DCS) and distributed energy resources management systems (DERMS).

The total value of shipments/sales of these 12 systems and application software categories delivered primarily to U.S.-based electric utilities and C&I customers, is now estimated to be more than $3 billion annually.  Some major systems providers are active in a majority of these market segments, with industry segment specialists also key participants.

The C&I segment accounts for about $120-$150 million in procurements of these systems, as developed primarily for electric utilities.1   However, EMMS offerings are primarily oriented to ISO/RTO community, and DERMS solutions are regularly purchased by renewables aggregators, as are specialized SCADA offerings for wind and solar applications.

Some of the segments are oligopolistic, in that only a handful of suppliers are actively serving that particular market.  EMS and EMMS are two such examples.  Other segments are characterized by fragmented market shares held by many suppliers, as evidenced in cyber security, OMS and MDMS market segments.

Individual reports are priced at $195.00 and the entire 12-report series is available for $1,450.00.  Each market overview report includes a segment description, estimated market size, market shares for key participants and a market outlook through 2024.

  1. C&I firms spend additional billions of dollars on vertical industry-developed OT and IT systems such as factory-based SCADA and related automation systems and software.  Distributed control systems with appropriate industry-specific applications and functions is another prime example.  Today’s cyber security investments are also targeted in part to vertical market requirements, as are mobile workforce management systems.  CIS/CRM systems are also widely deployed in several segments within the C&I marketplace.
Posted on

A Look at the 2021 T&D Services Market in the United States

Over the past decade, the need for on-site T&D equipment servicing and parts replacement has grown, both for electric utilities and for commercial and industrial customers. While Newton-Evans has studied this portion of the T&D market in a cursory manner over the decades, we have not produced a multi-client study of this important segment of T&D-related spending. Even now, our definition of T&D services is not all-inclusive, as there is significant related expense incurred for equipment testing services (about $450 Million) and even more investment for replacement parts for ancillary equipment like structures, connectors, line tools, et al, accounting for multiple hundreds of millions of dollars.

While much of the cost of T&D equipment services and repairs is grouped as operating expense, we believe there may be some “replacement parts” costs that are likely classified as capital expenditures, especially costly parts for large power transformers and components for HV substation equipment.

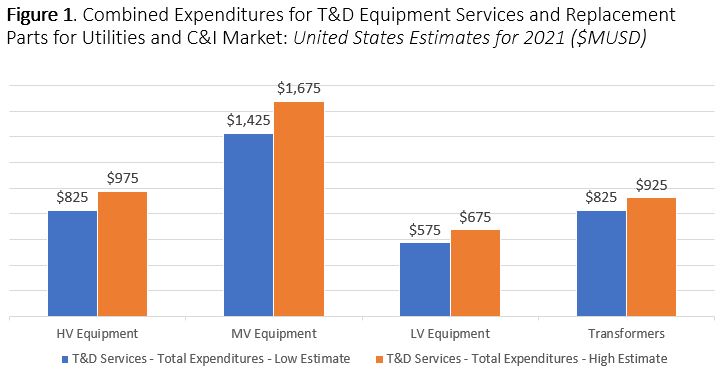
The total value of expenditures for T&D equipment-related services and replacement parts in the United States is likely around the $4 Billion level as of 2021, and our estimate for global spending on T&D services is in the $18-20 billion range. These estimates exclude the costs of equipment unit replacement. Together, T&D equipment services, including repairs and replacement parts, accounted for perhaps $3.6 Billion to upwards of $4.2 Billion in 2021. See Figure 1.

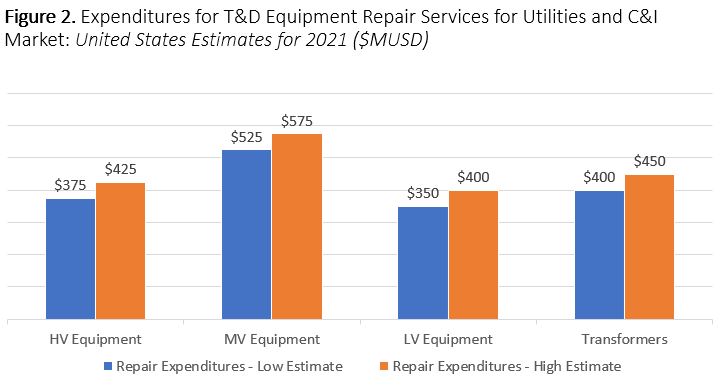
Looking at T&D equipment field services, including repairs and maintenance services performed by third parties, our mid-point spending estimate is $1,750 Million. See Figure 2.

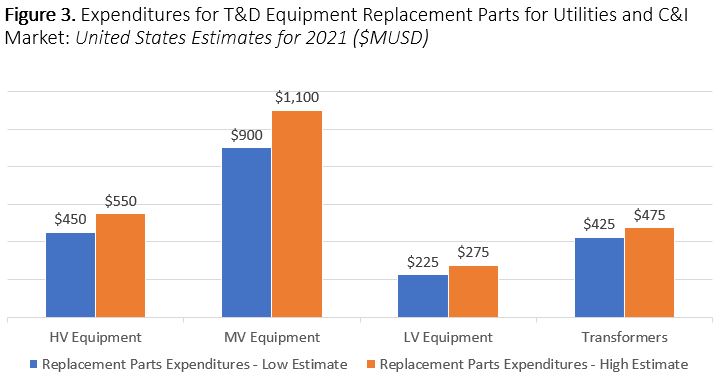
Similarly, the spending for replacement parts for HV, MV, LV equipment and for power and distribution transformers is estimated to be in the $2,200 Million range. See Figure 3.

The overall split of spending between utilities and the C&I community is about a four-to-one ratio in our view, with utilities accounting for the bulk of all HV, MV and transformer-related spending, but with the C&I group accounting for substantial portions of LV equipment services and replacement parts, some MV and transformer services, and occasional HV equipment servicing.

The largest portion of spending among the four categories studied for this article (HV, MV and LV equipment, and transformers of all sizes) is for MV equipment services and replacement parts. HV equipment services follow, then comes spending for power transformer services and LV equipment services.

Posted on

Outlook for Grid Modernization from IT and OT Perspectives: Recovering the Momentum Lost During COVID

Over the past two years, the pandemic has affected our lives, our businesses and the nation’s plans for infrastructure modernization, including the electric power grid. We had earlier (2020) forecasted rather robust growth in spending on IT, OT and smart grid initiatives in a grid modernization report prepared for a client organization.

During the first year of the pandemic, Newton-Evans conducted a small sample study (25 large and mid-size utilities) of the impact of COVID on electric power transmission and distribution capital investment projects.

Observations from that 2020 study indicated capital investment plans for some utilities had been scaled back by as much as 50% for 2020 and 2021. Other respondents reported that capital projects had been deferred for 12, 24 or even 36 months. A few utilities held fast to their pre-pandemic investment plans as long as they could do so.

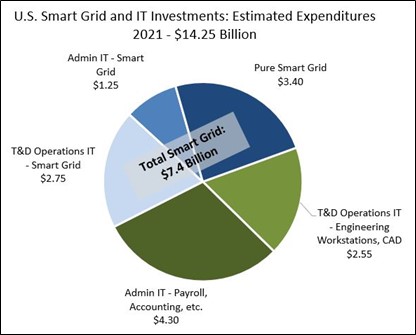
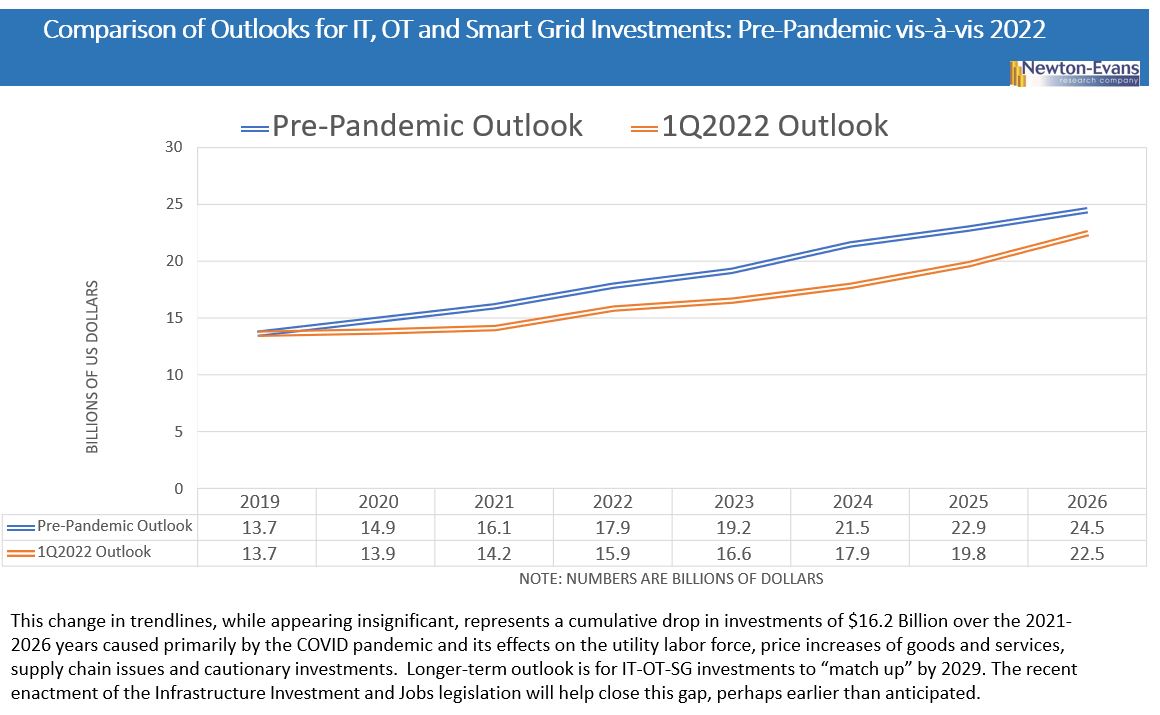
In Figure 1, note our belief that total 2021 expenditures for the combination of IT, OT and smart grid projects likely reached about $14.2 Billion. In 2020, Newton-Evans had estimated that 2021 would likely see about $16.1 Billion in these combined expenditures, but by that year, the pandemic had firmly taken hold, restricting the availability of utility workforce personnel. COVID also impacted the manufacturing of some electrical equipment and provision of consulting and engineering services related to IT, OT and grid modernization projects.


Figure 1.
NOTE: Total IT + OT + SG Expenditures = $14.25 Billion
($5.55 Billion for IT + $5.30 Billion for OT + $3.4 Billion for “pure” Smart Grid)
$14.25 B = about 4.75% of electric utility operating revenue or 3.6% of total electricity sales.
IT spending alone likely less than 2% of operating revenue.

Now, the question arises – What is included in “pure” smart grid investment? Here, we include smart grid devices and equipment that acquire and transmit data and other signals to monitor and/or control utility field operations outside of the substation fence. For the most part, these are 21st century developments or generational improvements over earlier “legacy” devices. Pole top RTUs, distribution line fault indicators and feeder monitors, multiple types of controllers (for capacitor banks, automatic circuit reclosers, voltage regulators, line mounted monitoring devices et al) and automated switches and protective devices).

The related advanced communications infrastructure including built-out portions of the utility wide-area networks, local area networks and supporting infrastructure for automatic metering equipment are also placed in the “pure” smart grid bucket. IT system components related to smart grid are typified by meter data management systems, the customer services links to outage management systems, and geographic information systems to name a few. Operations side systems and applications would include advanced distribution management systems which collect and aggregate the thousands of field data points now configured with intelligent electronic field devices mentioned earlier that assist in more effective operation of the distribution grid.

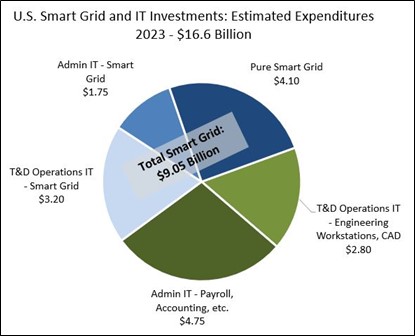
By the third quarter of 2021, some recovery in capital spending for transmission and distribution was underway, based on recent discussions with a variety of industry sources. Even now, in the first quarter of 2022, we are still in a cautionary progression, given the lingering concerns over, and the effects of the OMICRON variant on the utility labor force and on delays in equipment availability in some situations. By 2023, I anticipate combined investment in IT, OT and grid modernization projects as shown in Figure 3 below will increase to more than $16.6 Billion. When compared with a pre-pandemic outlook calling for about $19.2 Billion in such investment in the coming year this leaves a shortfall of $2.6 Billion.

Importantly, when utilities have been compared with other industries related to IT spending, at first glance the industry appears to invest relatively less of its revenues in IT and OT. However, we have found that even in this pandemic area, with total U.S. electric power revenues approaching $400 Billion, the investment in combined IT and OT, plus related portions of grid modernization technology projects (exclusive of the cost of grid modernization equipment), the level of capital spending for grid modernization is closer to the 3.6% – 4.0% investment level. IT spending alone hovers around 1.5%-1.9% of operating revenues. Adding in the industry’s investment in OT and in key technology aspects of smart grid projects, the relative investment in overall information technology in total climbs to a much more reasonable level. See Figure 2.


Figure 2.
Two key assumptions about this outlook:
1. COVID will be endemic, not pandemic, by 3Q 2022.
2. Infrastructure Investment and Jobs Act actually begins funding significant portions of the $72.3 Billion allocated for energy and electric power infrastructure renewal by mid-year 2022.

The impact of COVID on electric power industry investment during 2020 and 2021 and into 2022 has taken its toll. The question facing the industry and the nation is whether or not this estimated $16.5 Billion shortfall in grid modernization investment (as postponed or deferred from initial estimates) can be made up during the remaining years of this decade? My belief is that the investment gap will be narrowing over the next 36 months, as shown in Figure 3 below, and the pre- and post-pandemic trendlines will indeed converge in the latter years of the 2020’s. Closing the investment gap will especially be likely – and may occur earlier than anticipated with help from DOE funding. Much will depend on federal funds flows from the recently enacted Infrastructure Investment and Jobs Act – legislation that will enable additional billions of dollars to be provided for grid modernization programs and related energy projects. At least several billion dollars of the $72 billion or so earmarked for electric power modernization will be applied to IT, OT and “pure” smart grid projects, although the majority of the total budget is earmarked for transmission grid expansion, overall grid hardening and integration of renewable energy sources.

I believe that this forthcoming federal investment in the nation’s electric power grid – coupled with the investments of the nation’s utilities, must include funding for research and development of advanced technical solutions for ever higher levels of cybersecurity and grid resilience.

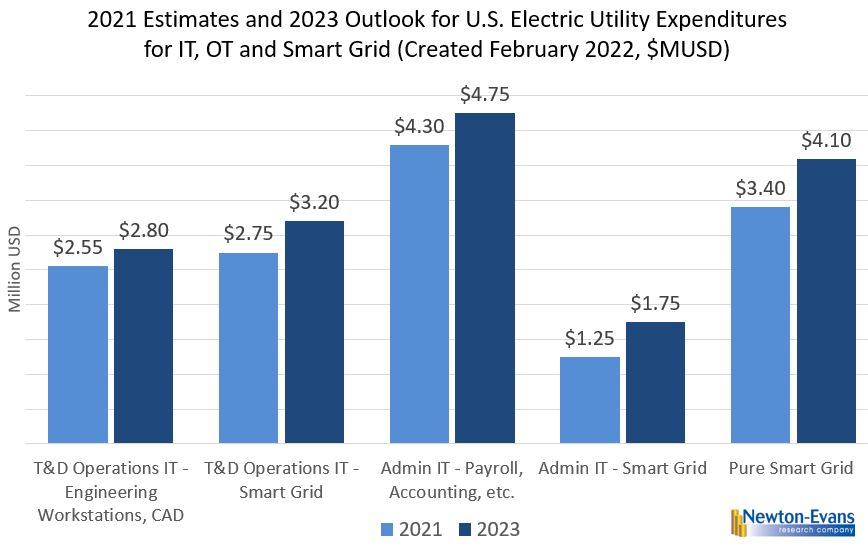
As of February 2022, the nation’s electric utilities are re-starting or initiating a number of grid modernization projects and programs, deferred in part over the past 24 months.  This activity will help boost IT, OT and smart grid device/equipment expenditures this year and into 2023. Figure 4 illustrates the near-term growth estimate we have made for the IT, OT and smart grid field components of capital investment as the effects of the COVID pandemic begin to wane in the first quarter of 2022.

Posted on

Sizing the Market for Electric Power Grid Modernization In an Era of Pandemic

According to the U.S. Department of Energy’s Energy Information Administration, annual spending on electricity distribution systems by major U.S. utilities continued to increase year-over-year through 2019, with major utilities spending some $57.4 billion on electric distribution in that last pre-pandemic year. More than half of utility distribution spending in 2019 went toward capital investment ($31.4 billion) as utilities worked to replace, upgrade, and extend existing infrastructure. Another $14.6 billion was invested in operations and maintenance (O&M), and $11.5 billion was appropriated for customer expenses, which included advertising, billing, and customer service.

In 2019, much of the $31.4 billion distribution system capital investment (40%) was spent on power lines, both underground (23% of investment) and overhead (17% of investment). Distribution lines are added or expanded to accommodate new neighborhood development or higher electricity flows as sales increase.1
Keep in mind that when spending by municipal electric utilities and electric cooperatives are added to the EIA totals, the amounts reported by EIA actually would increase by about 25-30%, at least in our estimation.  The bulk of this additional non-IOU spending was for distribution expenditures.

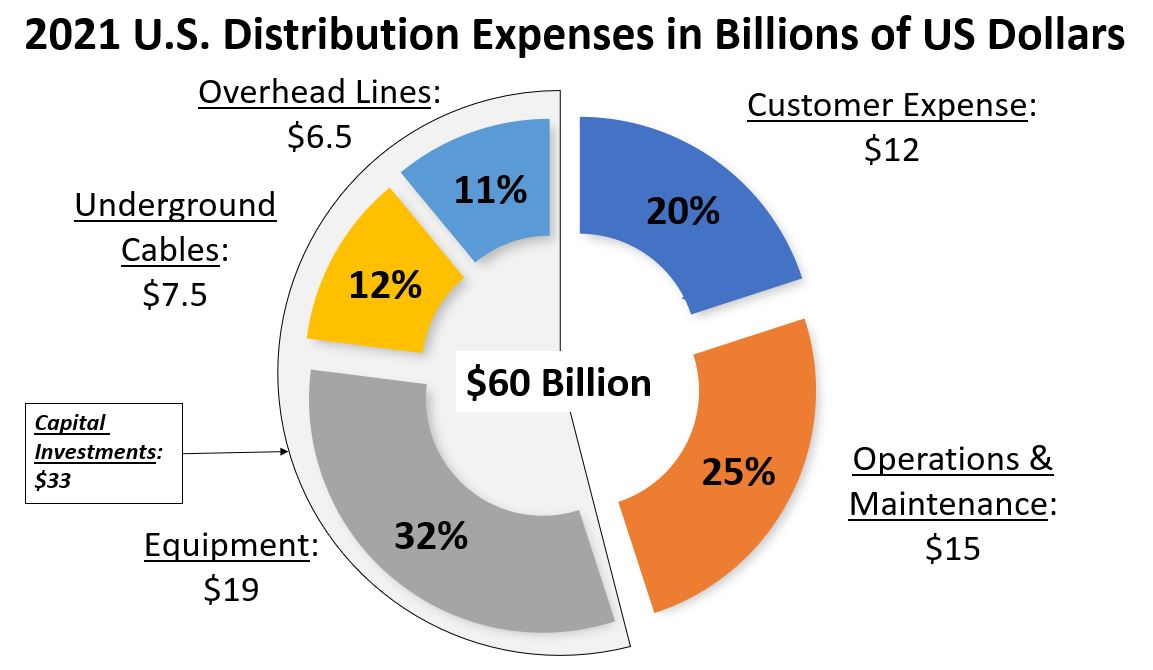
We have increased these amounts for 2020 and 2021, if only to account for inflationary pressures on prices of electrical equipment and systems. Thus, our view is that, in 2021, about $60 Billion was spent in total, on electric power distribution activities in the United States. Of this amount, $33 Billion was estimated for capital investment, and about $20 Billion of the total went for distribution equipment and systems.


Fig. 1

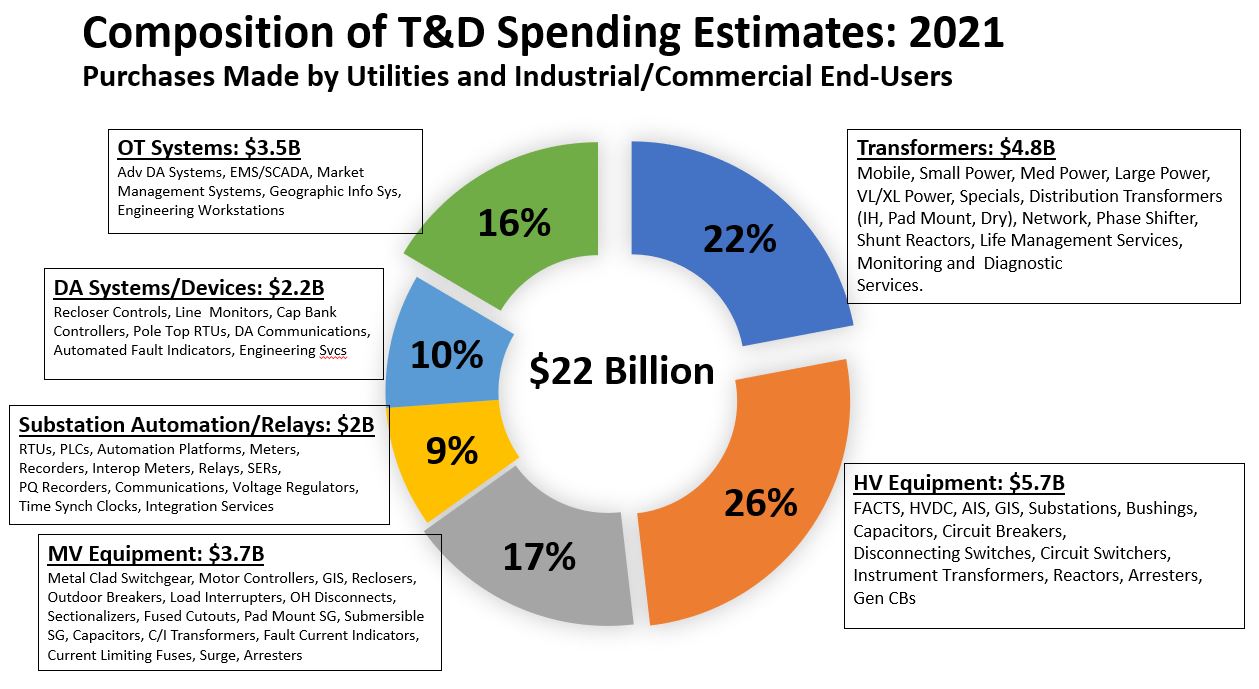
Newton-Evans’ recent year studies of U.S. combined utility and industrial/commercial spending for dozens of specific T&D products, equipment types and systems suggest about $22 Billion was invested in about 70 specific T&D equipment types in 2021.2 Note that this estimate includes spending for both transmission and distribution. In fact, the total expenditures for T&D procurements likely exceeded 100 billion dollars. See Figure 2.


Fig. 2

This $22 Billion shown in the above chart excludes additional billions of dollars invested in power lines, underground cables, electric power poles, meters and ancillary equipment as well as customer-related spending, certain substation construction and O&M services.

One recent Newton-Evans’ study of capital investment changes brought on by the COVID pandemic, resulted in an expected drop in CAPEX from 2019 to 2020, followed by stabilization and a moderate increase in spending for some areas in 2021. Some respondents cited this as a “deferral” of investments rather than a cancellation of investments at the time of the study.3 Nonetheless, total capital investment by U.S. electric utilities during the 2020 and 2021 years likely centered around the $130 Billion mark.4

If the nation (and the entire world) can move on from the ongoing pandemic era, to an endemic period, grid modernization investment may recover some of the momentum lost or deferred from the past 24 months. As well, the significance of the passage of the Infrastructure Investment and Jobs Act in November, 2021, cannot be overstated. More than $60 Billion dollars of funding under this new act has been allocated to the energy sector, most of that amount earmarked for modernization of the electric grid.

Sources:
1. U.S. Department of Energy, Energy Information Administration
2. Newton-Evans’ Market Overview Series on various T&D Topics
3. Newton-Evans Research Study of Capital Investment among U.S. Utilities in Midst of Pandemic Conditions (1-2 Quarters, 2020)
4. Newton-Evans Calculations of 1.28 x EEI/EIA estimate of $107 B. Newton-Evans’ estimate very similar to estimate prepared by Statista, which itself was sourced in part from S&P Global Market data.

Posted on

GE-PROLEC + SPX Transformer Solutions (Waukesha) – A Rising Global Powerhouse for Power Transformers

With the early October 2021 completion of the GE-PROLEC acquisition of SPX Transformer Solutions, the transformer manufacturing industry is again itself transformed a bit.  With this acquisition the combined GE-PROLEC venture now takes on a  co-leadership position in the “low power, middle range and higher range segments” of the U.S. power transformer market.

SPX Transformer Solutions has been the U.S. market segment leader in the manufacture and sales of small power, medium power and large power transformers.  GE-PROLEC was already a third-place contender in the U.S. market for medium power transformers, shunt reactors and phase shifting transformers.  Historically, GE has been a dominant supplier of network transformers as well, and remains a segment co-leader.  Neither GE-PROLEC nor SPX Transformer Solutions has been a market leader in the provision of mobile transformers/substations, but other than that particular segment, the combined unit shipments and dollar values likely provides GE-PROLEC a market leading share of at least five segments of the power transformer business.  While GE-PROLEC is a “top five” participant in each of the three major categories of distribution transformers (overhead liquid units, dry transformers and pad mount units), the acquisition of SPX Transformer Solutions has no effect on their standing for distribution transformers.

Transformer Monitoring and Diagnostics:

GE historically has offered a wide range of solutions to monitor and manage critical assets on the electrical grid, detect and diagnose issues and provide expert information and services to customers. GE’s asset monitoring and diagnostics portfolio includes solutions for single- and multi-gas transformer DGA, enhanced transformer solutions and switchgear monitoring, as well as software and services.  GE was early into the transformer DGA monitoring business with its 1999 acquisition of the Montreal-based Syprotec organization.  The company’s efforts in transformer monitoring developments since then have made it a global leader in transformer health monitoring and diagnostics.

Waukesha’s transformer service business has been a mainstay for SPX in years during which equipment sales were flat or down, with the company’s service capabilities and offerings extended to provide service for non-Waukesha power transformers.

Revenue Estimates:

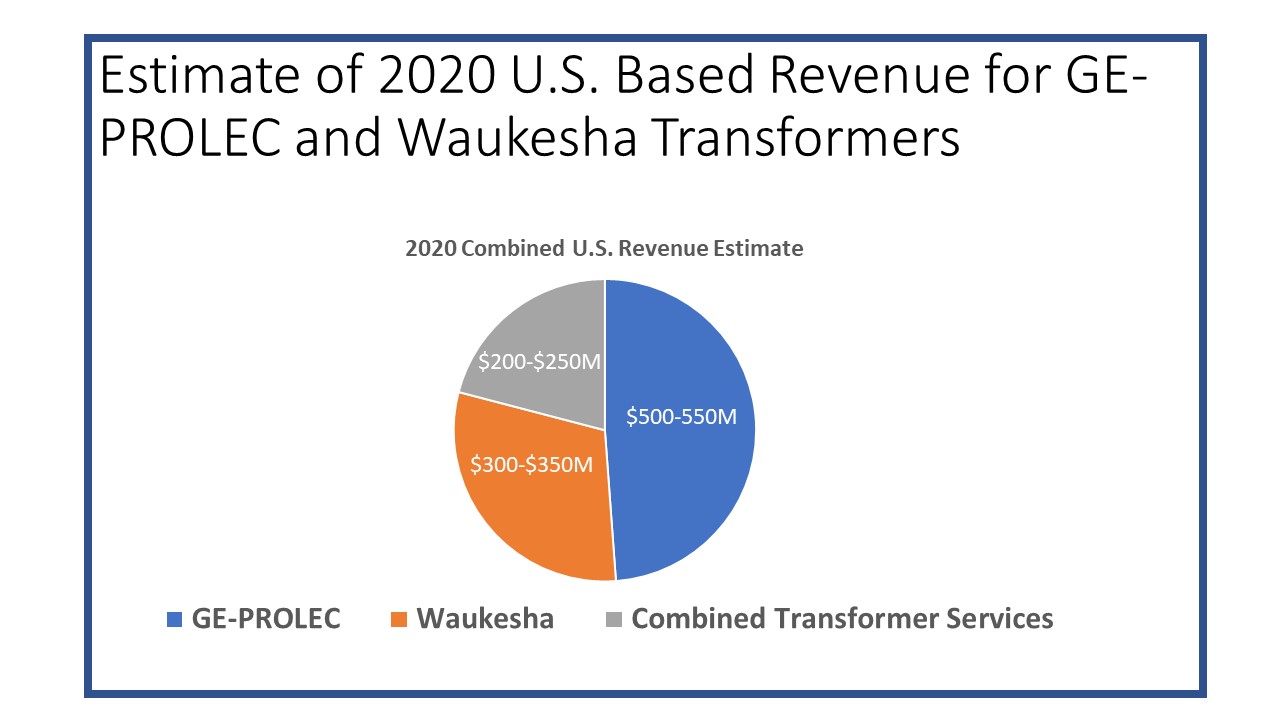
Newton-Evans estimates global revenues for the combined transformer equipment and services operations of the GE-PROLEC plus Waukesha (SPX Transformer Solutions) will exceed $1.5 Billion in 2021.  In the U.S. market, our 2020 estimate for GE transformer equipment sales in the U.S. market stands at $500-$550 million, and for Waukesha transformers our 2020 estimate of U.S. shipments is $300-$350 million out of a reported total of $427 Million in power transformer sales.

Combined GE-PROLEC and Waukesha transformer-related services and M&D device sales revenues in the U.S. are likely to reach $200 Million or more, with multiple regional service facilities operated by the combined business units.

Some History on GE’s Rise in the Power Transformer World Market

Back in 2014, during the time of GE’s acquisition of Alstom Grid, the latter firm was number three in the world in terms of large power transformer market share and assets, operating 13 plants with an annual production capacity of more than 130 MVA. GE Prolec was already a major North American market force with about a 14% share of the U.S. market.

At that same time in 2014, I had written the following: “Together, this alliance may become number three in the global market for large power transformers behind ABB and Siemens. To do so, the GE-Alstom combine will have to fend off HICO, Hyundai, Toshiba and MEPPI as well as three up-and-coming Chinese manufacturers.”  With additional non-organic revenue additions of nearly $500 Million achievable this year with combined reporting from Waukesha, GE-Prolec will indeed firm up its position as the third leading supplier of power transformers – no longer far behind Siemens Energy and Hitachi-ABB Power Grids.

 Sources: 

(1) Newton-Evans Research Company’s 2021-2023 edition of Market Overview Reports:  Transformer Series-Complete Set

(2) 2020 Annual Report for SPX Corporation.

(3) 2020 Annual Report for General Electric Corporation.

Posted on

Newton-Evans Research Releases 2021-2023 Edition of Nine Market Snapshot Reports on Distribution Automation Topics Covering the Electric Power Industry in the United States.

Newton-Evans Research Releases 2021-2023 Edition of Nine Market Snapshot Reports on Distribution Automation Topics Covering the Electric Power Industry in the United States.

U.S. Sales of Distribution Automation Components estimated at more than $1.9 Billion in 2020, Forecast to Increase to $2.3 Billion by 2023.

August 30, 2021.  Ellicott City, Maryland.  The Newton-Evans Research Company has announced its latest publication of a set of 9 U.S. distribution automation market two-to-four-page summaries.  The new series of market overview reports (executive market summaries) includes supplier listings, representative products, and estimated market segment size, vendor market share estimates and market outlook through 2023.   Electric utilities accounted for about 92% of all purchases of distribution automation related goods and services.

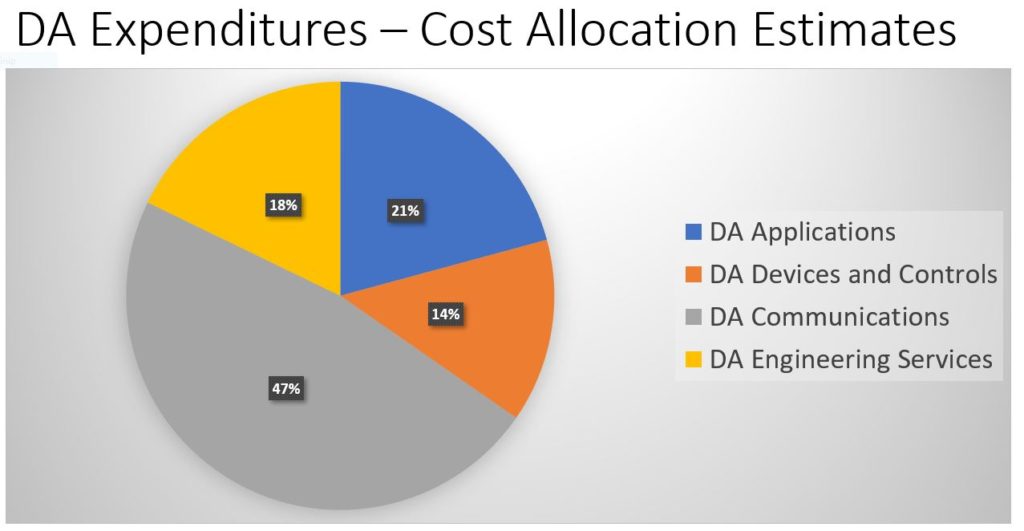
A majority of distribution automation equipment purchased by American utilities and industrial firms is produced or assembled in the United States.   U.S. sales of DA components including equipment smart controllers, DA applications software licensing, dedicated communications infrastructure and DA-related engineering services, is expected to exceed $2 Billion in 2021.  Another several hundred million dollars will be spent again this year for “DA-related infrastructure equipment” including reclosers, MV voltage regulators and MV capacitors.

The Distribution Automation series ($975.00) includes U.S. 2020 market size, market share estimates and 2021-2023 market outlook for these product and service categories:

  • DA01 – Automatic Circuit Recloser Controls
  • DA02 – DA/DMS System Components (including distribution network analysis; distribution network condition monitoring and fault location and characterization)
  • DA03 – Voltage Regulator Controls
  • DA04 – Capacitor Bank Controllers
  • DA05 – Fault Indicators (covering both fault current indicators and faulted circuit indicators)
  • DA06 – Pole Top RTUs
  • DA07 – Line Mounted Monitoring Devices
  • DA08 – Communications Components for DA (covering PLC/DLC; cellular and 900Mhz)
  • DA09 – Engineering Services for Distribution Automation Projects (covering consulting engineering services, related services provided by manufacturers; DA services provided by smart grid consulting specialists)

Importantly, in the chart below, note the pivotal role played by communications networks developed specifically for distribution automation applications being implemented by utilities across the nation.  The market overview (DA08) further allocates DA communications spending estimates by three external service types: (BPL/PLC/DLC), Cellular and 900 MHz MAS.

Three related T&D market series have been published over the past several weeks by Newton-Evans. These include: Power and Distribution Transformers (14 summaries); High Voltage Equipment (15 summaries) and Medium Voltage Equipment (17 summaries).

Further information on each of the four updated T&D market overview series, and three series not yet updated from 2018, comprise more than 85 individual U.S. electric power industry market summaries.  The market overviews both series and individual reports, are available from Newton-Evans Research Company, P.O. Box 6512, Ellicott City, Maryland 21042.  Visit the reports page for a sample and to order reports online. Phone: 410-465-7316 or visit www.newton-evans.com for a brochure or to order any of the related report series or any of the more than 85 individual report summaries online.  Chuck Newton can be reached at cnewton@newton-evans.com.

Posted on

SCADA Systems for the Renewables Energy Industry and ADMS For Utilities

Introduction:

Newton-Evans believes that there is significant opportunity for providers of SCADA-related systems and application software to help manage the operations of commercial and utility-scale wind and solar power resources.

The U.S. Department of the Interior’s USGS agency reports that there are about 67,000 large (utility-scale) wind turbines in operation in the United States.  These thousands of wind turbines are installed at about 1,500 sites or farms.  The country is adding about 3,000 utility-scale wind turbines each year. (!)

According to the U.S. Department of Energy’s EIA (Energy Information Administration), there are more than 2,500 utility scale solar plants/farms now operating in the United States.  Most of these facilities represent from 1 to 5 megawatts of generation capacity. (2)  There have been a number of larger solar plants coming onstream in the last five years.

Each of these 4,000-plus utility-scale renewables sites now operational in the U.S. requires a SCADA-like system to acquire operating information and to coordinate grid planning activities.  For enterprises operating multiple facilities, capabilities exist to coordinate multiple SCADA installations (or site automation/control systems) under the control of a larger company-wide or utility-wide SCADA system.

Wind Power SCADA

There are four types of SCADA providers serving the wind power industry as shown here:
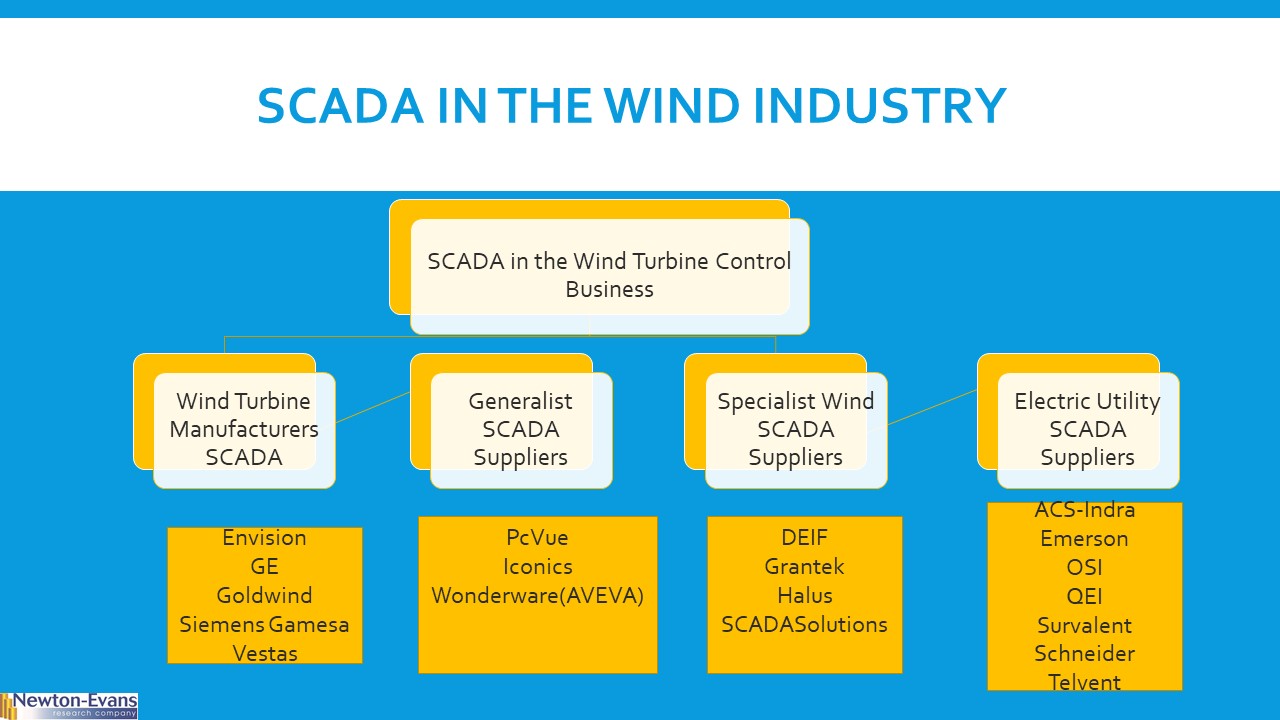


The first group of wind SCADA offerings is comprised of the leading wind turbine manufacturers for the U.S market, including GE, Siemens and Vestas, (collectively representing about three-quarters of US wind turbine sales) and supplemented with some Chinese manufacturer installations and supporting control systems software from either Goldwind or Envision, both of which have a U.S. presence and have current installations around the country.

The SCADA applications developed by each turbine manufacturer center around wind turbine controls, but the offerings also extend to include a bevy of related monitoring and control applications for commercial wind farms.  The SCADA offerings from these firms appear to be designed with current generation software platforms and incorporate some useful apps development tools – an optimal solution for those sites that make use of wind turbines from a single manufacturer.

The second group of wind SCADA offerings is provided by a number of wind technology specialist firms, including DEIF, Grantek, Halus and SCADASolutions.  Offerings from these firms enable wind farm operators having wind turbines acquired from multiple suppliers to work in an integrated manner, analogous to a substation automation system that has to coordinate among multiple protective relay suppliers.  Status reporting, turbine condition assessment, activity controls can be accomplished by the SCADA offerings from these suppliers, regardless of the turbine type, size or manufacturer.

The third group of wind SCADA offerings comes from “generalist” SCADA suppliers, those companies that provide packages or configurable SCADA to multiple industries, from energy utilities to process industries, to discrete product manufacturers and commercial building control systems.  Products from leading suppliers including PcVue, Iconics, Wonderware (Aveva) and others have all been successfully applied to numerous wind farms in the U.S. and elsewhere.

The fourth group of offerings that have made some inroads with utility-operated wind farms is provided by the “traditional” suppliers of electric utility SCADA, DMS and energy management systems.  Most of these firms have now developed requisite software or have partnered for development of wind energy applications, and have likely implemented wind applications for one or more utility customers at this point in time.  Included here are large companies such as ABB and Schneider, as well as key suppliers to the mid-size utility market and include firms as ACS-Indra, OSI, QEI, Survalent and others.

Solar Energy SCADA

The more than 2,500 utility-scale solar farms operating in the U.S. also have a requirement for SCADA systems.  Similar to the groupings of SCADA providers in the wind sector, there are four major types of solar SCADA offerings for the U.S. market.

There are at least five solar SCADA specialist firms operating in the U.S. market in 2021 having currently installed solar SCADA systems, and there are likely additional firms operating on a regional basis around the country.  These firms primarily serve commercial solar energy facility operators.
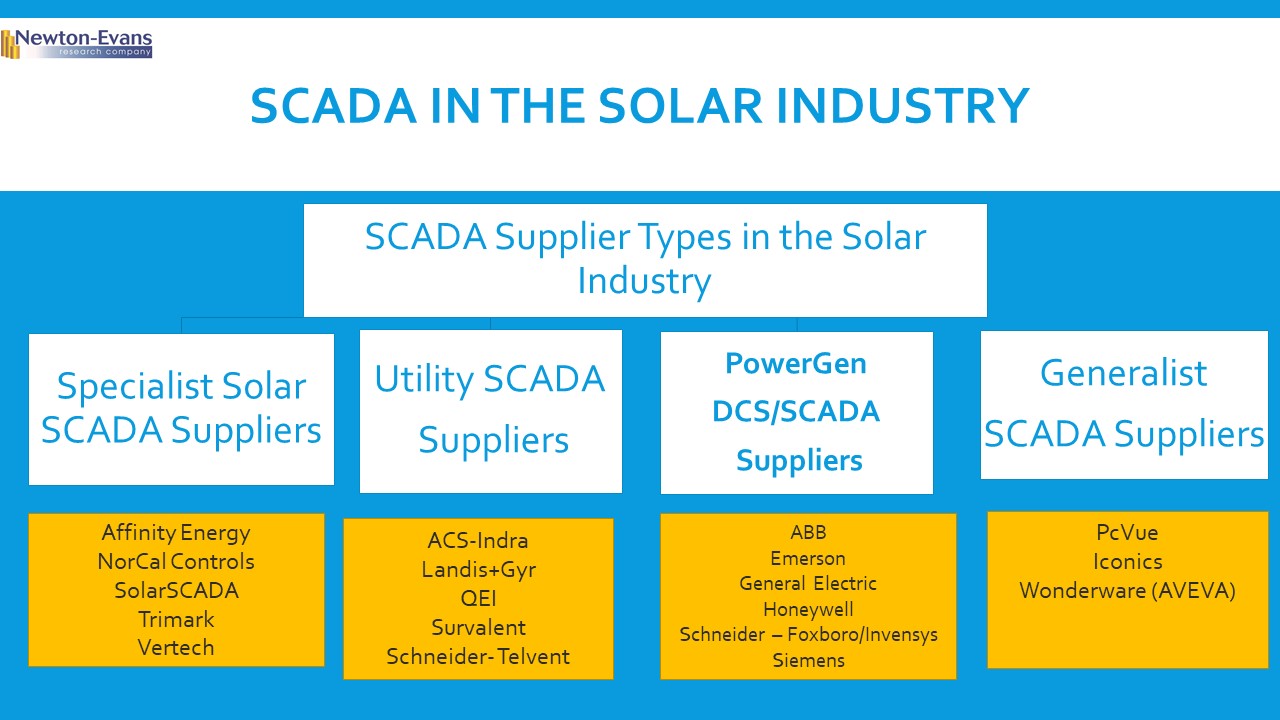
Distribution utility SCADA providers have also developed several solar and DERMS applications of interest to their utility customers operating solar facilities.  If not solar applications specialists themselves, the utility SCADA/DMS systems can partner with or link with offerings from solar IT/OT specialists

The third group of solar SCADA providers is comprised of: a) large firms that have traditionally provided distributed control systems for electricity generation plants; and b) the multinational firm providing large-scale EMS/SCADA/ADMS systems.

Generalist SCADA suppliers that were listed earlier for the wind farm sector of renewables are also actively participating in the solar market as well.

The Utility Role in Aggregating Non-Utility Renewables (Utility-Scale Distributed Energy Resources)

Recently, the NREL reported that “Although 23 utility-led efforts exploring DER aggregation were launched in the United States by late 2018, DERMS remains in the nascent stages of implementation, with many utilities still in the process of exploring or piloting the range of available commercial solutions.” .(3)

Newton-Evans Research had earlier estimated that the U.S. utility DERMS market in 2020 had reached about $75 million and is likely to double to $150 million by 2024. (4)

Control is the Key

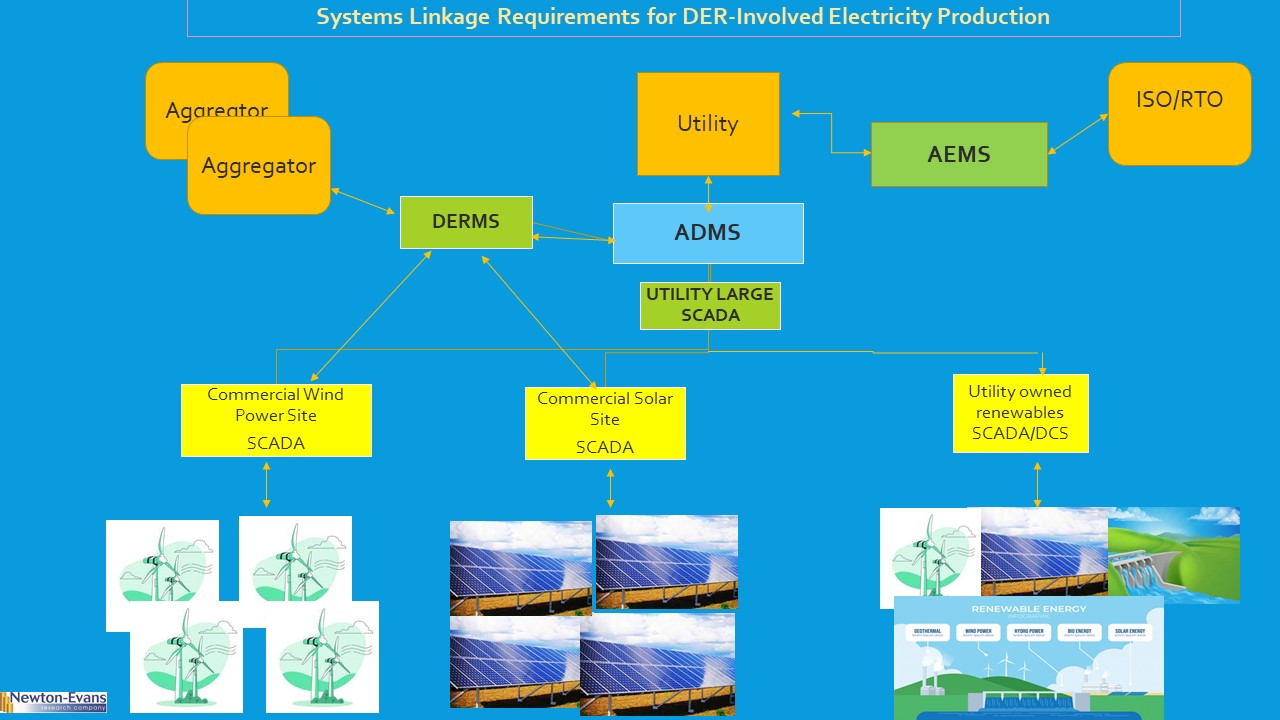
Importantly, the less control over renewable energy resources that the utility industry has (at both the transmission and distribution levels) the more tightly coupled and securely linked must be the control systems with which the utility can best manage operations to ensure grid stability.  This is why there is a separation between SCADA at the distributed energy resource site level which must be in place for operational data acquisition and is the rationale for the utility to have an up-to-date GIS providing DER locational data, supplemented by weather information as part of (or available to) it own DERMS and/or available to (or co-resident with) the DER site(s).

The prosumer-aggregator category of DER supplier adds yet another dimension lending additional urgency to the need for a comprehensive and scalable DERMS designed specifically for utility use.  While the author has read about the need for DERMS at the renewable facility level, the real need at these thousands of sites is for a SCADA-type system that can summarize information for the asset owner/operator and transmit requisite information securely to the utility entity (transmission or distribution-level) to enable the utility to optimize grid operations.  Multi-site renewables facilities will need their own large system to manage all assets regardless of location.  A fine example of a multi-site (on a nationwide scale) renewables SCADA system and national control center) is that of Iberdrola. (5)

What seems clear at this time is that the inclusion of renewables owned by aggregators (commercial and community levels) as electric power generation resources adds significant complexity to the already sophisticated nature of utility-operated transmission and distribution grids.  A quarter century ago, most power generation assets were under the direct control of utilities.  That is no longer the situation with an ever-increasing portion of power generation coming from renewables, and with a high percentage of renewables sites not owned or operated directly by regulated utilities.

In turn, a smooth-running grid will require ever-closer systems and telecommunications collaboration among T&D utilities, ISOs/RTOs, aggregators and regulators.  Disparate systems will have to be linked to some degree, with secure and reliable communications becoming absolutely vital to the safe, secure and reliable operation of the country’s power grids.  It will be incumbent on utilities to manage these complex relationships with all the technical resources available, because after all is said and done, it is the nation’s electric utilities that are charged with the operation of the grid on local and regional levels.

The increasing complexity of today’s grid architecture and the challenges posed to IT/OT staffs to develop comprehensive systems that can meet current and likely regulatory requirements to safely and securely accommodate commercially-owned power generation assets is among the greatest challenges found in any sector of the nation’s industrial, commercial, government sectors.  The need is paramount for a new generation of ADMS, AEMS, DERMS, SCADA/DCS. GIS and DRMS that are each based on open standards, configurable, scalable and capable of providing two-way telecommunications pathing.

Here is one view of how renewables SCADA systems are playing and will continue to play an important role in enabling utility-level coordination among aggregators at the commercial and community levels, and aligned with regional requirements of ISO/RTO organizations.


  1. Source: https://www.usgs.gov/faqs/how-often-us-wind-turbine-database-updated?qt-news_science_products=0#qt-news_science_products
  2. Source : https://www.eia.gov/todayinenergy/detail.php?id=38272
  3. National Renewable Energy Laboratory (Washington, D.C.)  Expanding PV Value: Lessons learned from Utility-led Distributed Energy Resource Aggregation in the United States, https://www.nrel.gov/docs/fy19osti/71984.pdf.
  4. Note that the Newton-Evans’ growth estimate, though moderately strong, is in fact lower than that of other energy research and consulting firms having a focus on DERs and DERMS.
  5. IberdrolaNational Control Center: the most advanced renewable energy control center in the United States. https://www.iberdrola.com/innovation/core-renewable-energy-operation-center-usa

 

Posted on

Newton-Evans Research Publishes 15 Market Snapshot Reports on High Voltage Power Equipment and Transmission Substations

March 22, 2021.  Ellicott City, Maryland.  The Newton-Evans Research Company has announced publication of a set of 15 U.S. high voltage equipment and substation market two-to-four-page summaries.  The new series of market overview reports (executive market summaries) includes supplier listings, representative products, and estimated market size for each topic, including vendor market share estimates and market outlook through 2023.   Electric utilities accounted for about 86% of HV-related equipment and transmission substation spending overall.

  • Commercial and industrial end-users accounted for more than $300 Million on substation construction projects in 2020, according to Newton-Evans’ estimates. Much of this amount was for construction of renewable energy gathering substations.
  • Substation construction represents the largest single investment area among all bulk power system components.
  • HV gas-insulated substations and gas-insulated switchgear represent a growing segment of bulk power-related investments. Growth is likely to accelerate once non-SF6 gas alternatives are more widely available for higher voltage equipment.
  • NERC projections suggest that as many as 14,000 HV line miles will be constructed over the 2021-2030 period. Importantly, more than one half of the expected expansion will be at 200kV or higher.  This will mean a need for about 250-300 new/up-rated transmission substations.
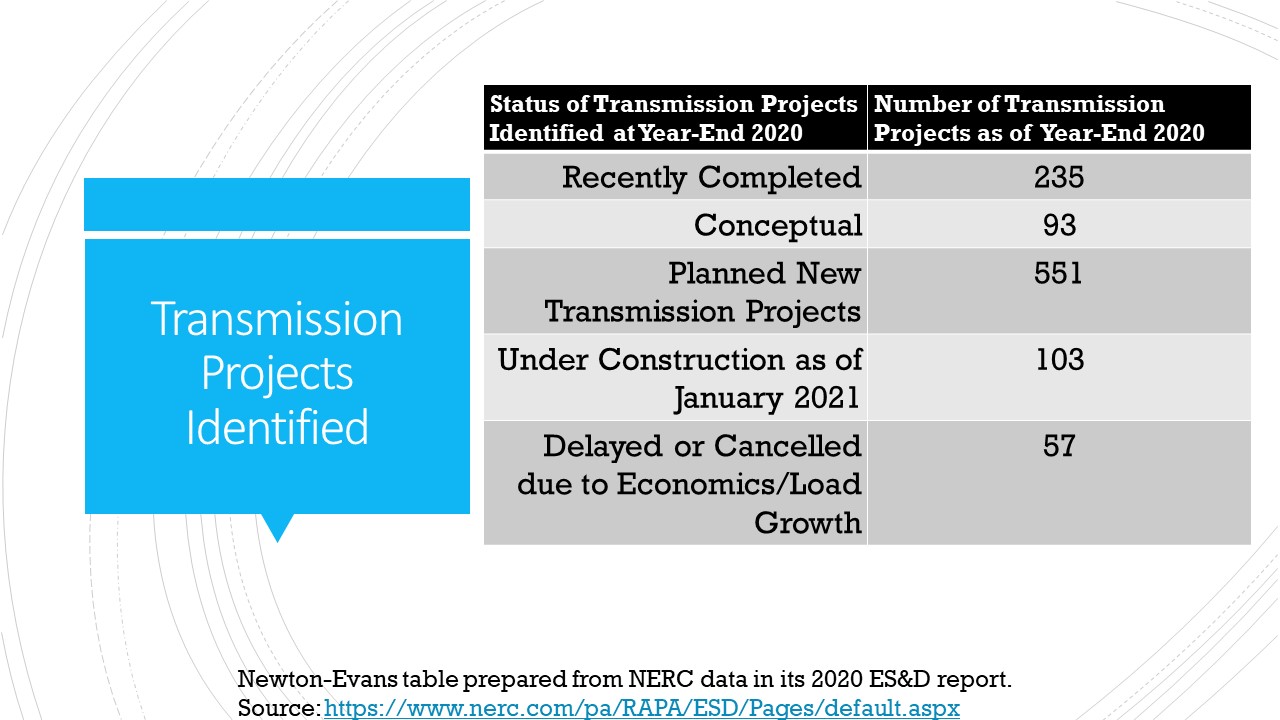
  • IOUs, G&Ts and federal agencies were most closely identified as having HV substation construction plans. Distribution cooperatives, municipal operations and industrial sites were more likely to plan MV substation construction projects.  Following is a look at identified transmission projects.


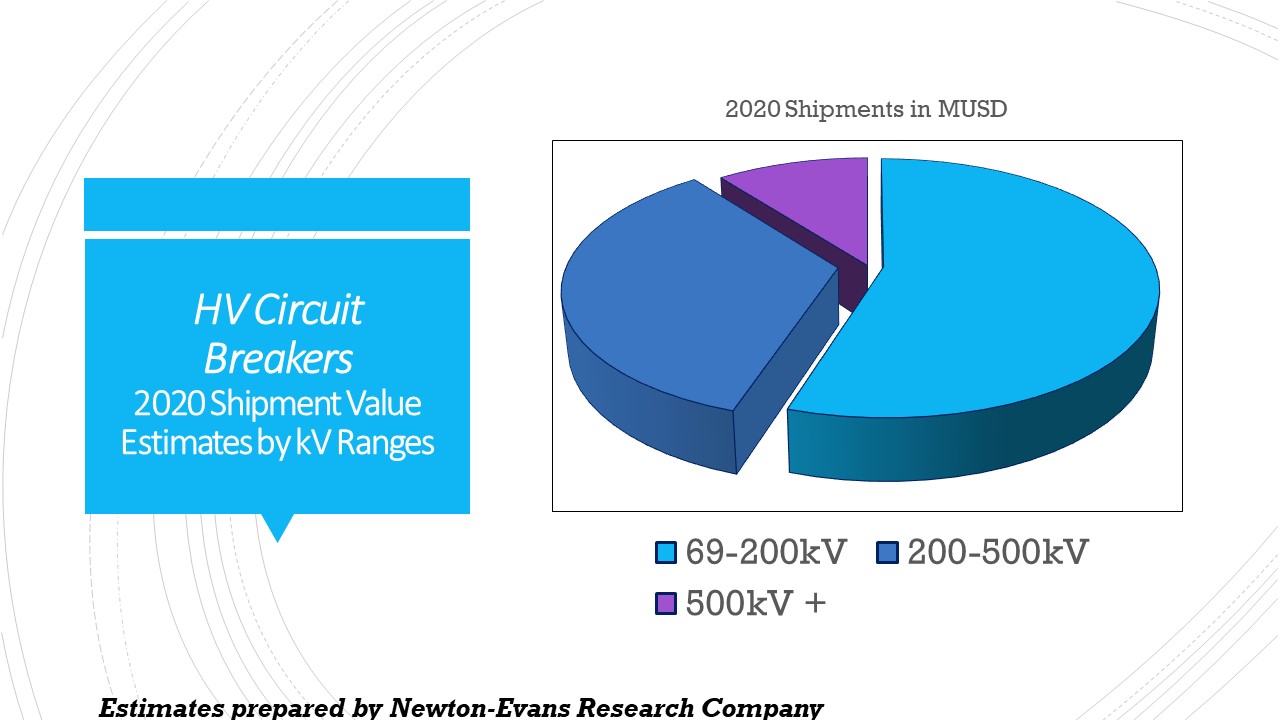
  • HV circuit breaker shipments likely exceeded $900 Million in 2020, with more than one half of the total investment made for 69kV-200kV range of breakers.


Further information on the 2021-2023 series of U.S. High Voltage Equipment market overviews is available on the Newton-Evans Research Company website:  https://www.newton-evans.com/our-reports/ for a brochure or to place an order for this new series or many other available T&D-related market reports.  This series is available via online purchase and immediate download.  Individual HV topical reports are priced at $150 per report, and the entire 15-report series is priced at $1,250.00.  Newton-Evans Research Company, P.O. Box 6512, Ellicott City, Maryland 21042. Phone: 410-465-7316.

Posted on

Estimated U.S. Sales of Power and Distribution Transformers and Related Services Accounted for $4.8 Billion in 2020, Forecast to Increase to $5.0 Billion by 2023.

Newton-Evans Research Publishes 14 Market Snapshot Reports on the Power and Distribution Transformer Industry in the United States.

February 1, 2021.  Ellicott City, Maryland.  The Newton-Evans Research Company has announced publication of a set of 14 U.S. transformer market two-to-four-page summaries.  The new series of market overview reports (executive market summaries) includes supplier listings, representative products, and estimated market size for each topic, vendor market share estimates and market outlook through 2023.   Electric utilities accounted for about 81% of purchases of power transformers and 75% of distribution transformers.  Commercial and industrial end-users accounted for the lion’s share of the dry-type transformer and special purpose transformer markets.

More small-power-to-very-large power transformers now are being manufactured in the U.S. recently, thanks to two key factors including: (1) the U.S. siting of large power transformer production facilities by several manufacturers over the past decade and (2) the mid-year 2020 Executive Order on Securing the United States Bulk Power System (though that EO is currently on hold/under review for 90 days).

The Newton-Evans Power Transformer Market Overview series ($1,250.00) includes U.S. market size, market share estimates and market outlook for these 14 transformer-related product and service categories:  TX01 – Mobile Transformers;  TX02 – Small Power Transformers;  TX03 – Medium Power Transformers;  TX04 – Large Power Transformers;  TX05 – Very Large Power Transformers;  TX06 – Shunt Reactors;  TX07 – Special Transformers (Arc, Furnace);  TX08 – Distribution Transformers (OH, Oil, 5kva+);  TX09 – Distribution Transformers (Dry Type);  TX10 – Distribution Transformers (Pad Mounted);  TX11 – Network Transformers;  TX12- Phase Shifting Transformers; TX13 – Transformer Life Management Services; and  TX14 – Transformer Monitoring & Diagnostics Equipment and Services.

Further information on the 2021-2023 series of U.S. electric power transformer market overview series is available  on the Newton-Evans Research Company website:  https://www.newton-evans.com/our-reports/ for a brochure or to place an order for this new series or many other available T&D related market reports.  This series is only available via online purchase and immediate download.  Individual transformer topical reports are priced at $150 per report, and the entire 14-report series is priced at $1,250.00.  Newton-Evans Research Company, P.O. Box 6512, Ellicott City, Maryland 21042. Phone: 410-465-7316.

-30-

Posted on

Presenting the 25th Annual ARC Industry Forum Accelerating Digital Transformation in a Post-COVID World February 8-17, 2021 – Online


Newton-Evans Research is pleased to offer its hundreds of utility contacts an opportunity to participate in the upcoming ARC Advisory Annual Forum during February 8-17, 2021 with complimentary registration.  Many of the scheduled sessions during this period directly impact IT and OT developments that are being planned or already underway within the electric utility community.  Newton-Evans has long been supportive of technology transfer that can benefit all infrastructure component industries.


Propelled by recent global health and economic crises, industrial innovation is accelerating.  Leading companies progressed along their digital transformation journey and quickly adapted to the changed business reality.   They supported remote connected workers far earlier than expected, and leveraged advanced technology to support the remaining front-line workers in the plant, in offices and out in the field.  With what they have learned, they are re-thinking how to manage operations using shared data, analytics, distributed work, and digital twins.  Join us to learn from your peers as executives charged with driving transformation are seizing this moment to innovate and deliver real value for both IT and OT applications developments.
    • Cybersecurity and Safety
    • AI and Machine Learning
    • Asset Performance Management
    • Blockchain for Industry
    • Supply Chain Transformation
    • IT/OT/ET Convergence
    • Automation Innovations
    • Industrial IoT Platforms & Edge Devices
    • Digital Twins & Connected Smart Machines
    • Smart Cities Transformation

Digital Transformation Council (End Users Only)

The Digital Transformation Council is the place to Connect, Collaborate, Learn, and Share with peers who are digitizing and transforming their organizations.  DTC is an end user only community; technology suppliers are not allowed to participate.

Need for digital transformation for industrial organizations and cities will continue to accelerate and evolve for some time.  Every organization and municipality will need to innovate, change, and adapt.

So, where to begin? How can you determine which technologies and techniques to consider, which to prioritize, and which to reject?  The answer will certainly be different for each organization, but a good starting point is to understand the critical dimensions of the problem, because this can serve as the basis for planning.  Council members can benefit from access to a community of peers.

Digital Transformation Council Mission

The Digital Transformation Council seeks to enable industry, energy, and public sector professionals driving or impacted by digital transformation to keep abreast of the many emerging technologies and business trends, to learn from others on similar journeys, and to leverage these trends and technologies to achieve transformational growth.

Council members benefit from access to community of peers.  They can tap the latest thinking from thought leaders, download research documents from the Council Library, participate in quarterly web meetings and other events, interact with ARC analysts, and request facilitated meetings with suppliers or other community members

Join us at the 25th Annual ARC Industry Forum to learn more about how digitizing factories, cities, infrastructure and supply chain will benefit technology end users and suppliers alike. Discover what your peers are doing today and what steps they are taking in their respective journeys. Visit ARC Industry Forum for up to date information on the speakers and agenda.

One key session at the ARC Forum Day 5 – Feb 16 at 2:30 pm EST is titled “The Future Electric Grid” – and that panel discussion in itself should make your registration worthwhile.

Learn More about ARC’s Digital Transformation Council.
The 4th Annual Meeting will be held Monday afternoon at the Forum.

Forum Fee

As an electric utility end-user of technology, you are welcome to register as a DTC Member.  DTC is an end-user only community, you are invited to visit ARCweb to learn more about this community. You may unsubscribe from this community at any time.  Please use your business email to receive your complimentary ticket. If for some reason, you can not use your business email to register for this event, please Contact ARC so that we can approve your registration.

ARC Forum main page:  https://www.arcweb.com/events/arc-industry-forum-orland0

ARC Forum Agenda:  https://www.arcweb.com/events/arc-industry-forum-orlando/agenda-2021

ARC Forum Registration:  https://www.arcweb.com/events/arc-industry-forum-orlando#register


Posted on

Newton-Evans Research Reports Planned for 2021


Newton-Evans is planning to publish the following reports during 2021:

First Quarter 2021

U.S. Market Overviews: Power and Distribution Transformer Series:  2021-2023

U.S.Market Overviews:  High Voltage Equipment Series:  2021-2023

Second Quarter 2021

World Market for Substation Automation:  2021-2023 – Four Volume Set of Reports

U.S. Market Overviews: Medium Voltage Equipment: 2021-2023

Third Quarter 2021

U.S. Market Overviews:  Substation Series:  2021-2023

U.S. Market Overviews: Control Systems Series: 2021-2023

Fourth Quarter 2021

World Market for EMS, DMS, SCADA and OMS: 2021-2023 –  Four Volume Set


Posted on

Network Transformers – Linchpins for Underground Electricity Distribution Networks

North American Study of Network Transformer Use and Plans in Progress through August 2020.

Preliminary Findings Suggest Increased Use of Network Transformers Likely as Underground Distribution

Increases in  Dense Urban Centers and on Large Commercial and Industrial Campuses

August 18, 2020.   Ellicott City, Maryland.  The Newton-Evans Research Company is conducting a major study of usage trends and plans for network transformers used to supply power to grid-type secondary distribution networks and systems in areas of high load density, typical of large urban areas, and are designed for use in vault type or subway type applications, in scores of cities and some suburban areas  and large C&I campus-like settings across the North American grid.

Network transformers may be oil-type or dry-type units, and of either single-phase or 3-phase design. Underground submersible units being purchased currently are likely to comply with IEEE standards requirements approved in 2016 (C.57.12-24) and for 3-phase units <2500kva (C.57.12-40) as approved in 2017.  Usage of network transformers is limited to underground networks found in major metropolitan areas served by IOUs, large municipal utilities and in a few high-density suburban areas served by distribution cooperatives

Product distribution channels used include purchasing direct from the manufacturer, distributors, and occasionally, manufacturer representatives or sales agents.  Major IOUs serving large cities having underground distribution networks tend to use blanket purchasing arrangements with selected manufacturers.

Most currently installed units across North America utilities are oil type units.  About three-quarters of respondents to date prefer to purchase network transformers paying a higher initial cost and minimal service requirements, while one-quarter prefer a lower initial cost with an ongoing service agreement.

Product safety has been ranked as the most important feature of network transformers among the initial group of respondents, followed closely by operating life expectancy.  Product efficiency of operation and prior field experience with equipment manufacturers were also important among this group.

Significant volume users of network transformers were unanimous in reporting that new underground, submersible transformers must meet current IEEE requirements and all network transformers are expected to comply with IEEE C57.12-40.2017.

When asked to indicate whether network transformers were being used in conjunction with other devices, network protectors and protective relays were especially prominent as noted by respondents.  A few also noted use of surge arresters on the high voltage side of the transformer and some have also reported including network transformers in their utility transformer asset management software.

For utility engineering and operations personnel who may wish to participate in the study, please send an email request to cnewton@newton-evans.com and a survey link will be forwarded.  A report of findings will be shared with participants.  All submissions are held in confidence. Only aggregated information is used in report preparation.  Generous stipends/donations are available. The field work will be completed in August, 2020.

– 30 –

Posted on

North American Study of Voltage Regulator Use and Plans Now Underway.

Preliminary Findings Suggest Increased Reliance on VRs Likely Given the Continuing Growth in Use of DERs and PBRs


August 4, 2020.   Ellicott City, Maryland.  The Newton-Evans Research Company is conducting a major study of usage, trends and plans for voltage regulators used to assist in maintaining voltage stability and reliability across the North American grid.

While the use of single-phase VRs can be found among all types and sizes of electric utilities across North America, three-phase units tend to be found primarily among larger investor-owned utilities, and among some G&T cooperatives.

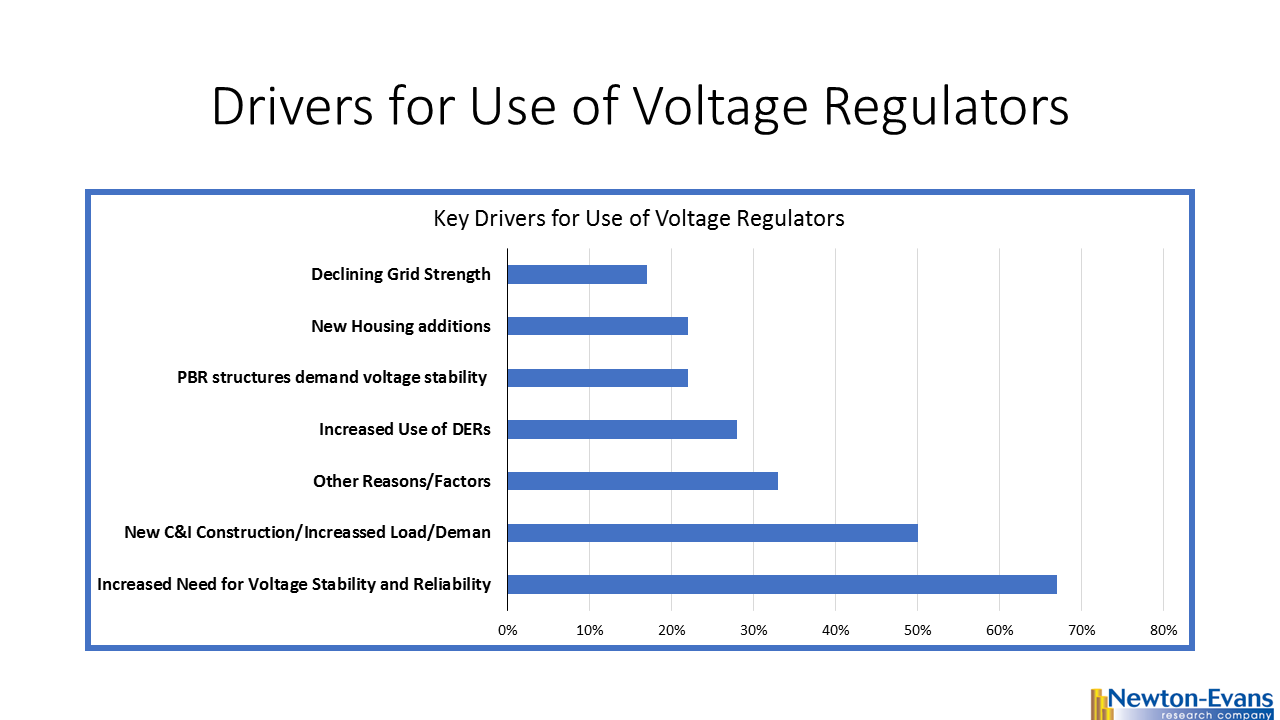
The key drivers for using VRs in the distribution grid today are led by the increased requirements for voltage stability and reliability, as reported in the responses from two-thirds of the initial 20 utility participants to date.  Importantly, C&I construction activities, linked with subsequent increases in load/demand, also have been ranked highly as a driver for increased use of VRs.  In addition, the increased implementation of DERs on the grid, a key factor in today’s grid voltage fluctuations, provide yet another key reason for using VRs to help provide grid stabilization.

Additional topics being studied include phase-to-ground voltages used in conjunction with VR; the use of VRs with other voltage improvement devices such as distribution feeder capacitors and substations capacitors; purchasing methods and preferences; installation methods, requirements for unit compliance with the latest IEEE requirements, wish lists for new VR product capabilities and a number of other pertinent topics.
For utility engineering and operations personnel who may wish to participate in the study, please send an email request to cnewton@newton-evans.com and a survey link will be forwarded.  Findings will be shared with participants.  All submissions are held in confidence. Only aggregated information is used in report preparation.

Posted on

Initial Thoughts on the Executive Order on Securing the United States Bulk Power System

On May 1, 2020, the President issued an Executive Order that forbids American electric utilities from purchasing (or utilizing) grid-related equipment obtained from countries viewed as adversaries.

There is not a clear definition of “adversary” provided in the executive order at this point in time.  It seems that such a listing must be made public for utilities to know what to do in the coming months.  Neither is there a clear definition of which products and equipment types are included, although common sense suggests that any “smart grid” equipment or device that can communicate externally would or should be closely evaluated.

However, this layman’s interpretation of the order puts the onus of having to identify the source country and component manufacturer for each component in the supply chain, and that is going to be a real challenge for some.  This is because there is an increasingly complex multi-layered array of capital equipment, devices, systems and software in use at hundreds of American electric utilities. The onus will fall to an even greater extent upon the manufacturers and integrators serving the electric utility community.

There is a reasonable requirement for electrical equipment manufacturers to be able to identify the source country of origin (COO) for every component of a smart device – even down to the foundry level in some instances.  This has been true for Milspec-related federal procurement for decades.

Importantly, domestic and international electrical equipment suppliers –both manufacturers and distributors – will now have to provide more depth to their equipment certificates that ensure traceability of origin, including tracing components from trusted sources located in approved countries.

It will come as no surprise that the initial list of “blacklisted” countries will very likely include China, North Korea, Iran and Russia, even though that list has not yet been officially made public.  Fortunately, there is very little use of finished “smart” goods from these countries in operation in the U.S. at this time.

Just as important- or perhaps more so – for software systems as for hard goods and components, it will be critical to identify the specific locations used for developers of source code for all smart grid software modules, programs, apps and packages.

What is quite clear to me is that, in the US, and among Western nations in general, electric utility standards and procurement officials must be prepared to ascertain the sources of already deployed smart devices throughout the electric power grid that could adversely affect electric grid operations at some point in time.  This is in addition to the thousands of smart grid projects now in the planning phases here at home and throughout the free world.

Among the plethora of smart grid devices now in use, the most important to vet will be digital relays – both loose relays and those embedded in generators, transformers, switchgear and other equipment.  Next in importance are the hundreds of thousands of communications-centric transmission and distribution level monitoring and control devices including dynamic line rating devices, line monitors, pole-top RTUs, smart controllers for capacitor banks, voltage regulators, automatic reclosers and sectionalizers.

Smart substation equipment (protective relays, electronic measurement devices, precision time measurement devices, power quality monitors, synchrophasors, et al) is now deployed in a majority of the nation’s 65,000 primary T&D substations.  At the consumer level, smart meters are at the top of the list of devices to be assessed, already deployed by the millions of units, whose component assemblies will likely need to be authenticated.  Digital fault recorders are installed in hundreds of critical manufacturing sites. Motor controls and associated relays are installed in thousands of manufacturing plants and in power generation facilities.

Moving into the sector of distributed energy resources, there are smart devices and attendant communications modules involved in, and embedded with, both wind and solar generation as well as in energy storage.  Wind turbine controls, smart inverters, small secondary substations whose final assembly may occur in the Western nations will have to verify sources of components, motherboards and microchips.

– Chuck Newton

Posted on

U.S. Electric Power Utility Capital Investment in Grid Modernization: Effects of COVID-19 Pandemic on Near-Term and Mid-Term Outlook

U.S. Electric Power Utility Capital Investment in Grid Modernization:  Effects of COVID-19 Pandemic on Near-Term and Mid-Term Outlook

Interim Report By Charles Newton, Newton-Evans Research Company

This article has been developed based on findings from surveys completed by officials from 22 U.S. electric utilities comprising about 10% of served end-use customers.  To date, the mix of participating utilities includes several IOUs, along with public power utilities and electric cooperatives.

The study is being undertaken to determine the effects of the COVID-19 pandemic on utility grid modernization plans involving capital expenditures.  Newton-Evans has requested the participation of major and mid-size American electric utilities in an attempt to gauge whether or not CAPEX investments will continue to be made as planned earlier, and whether grid modernization projects will continue as scheduled or will likely be deferred for some time.

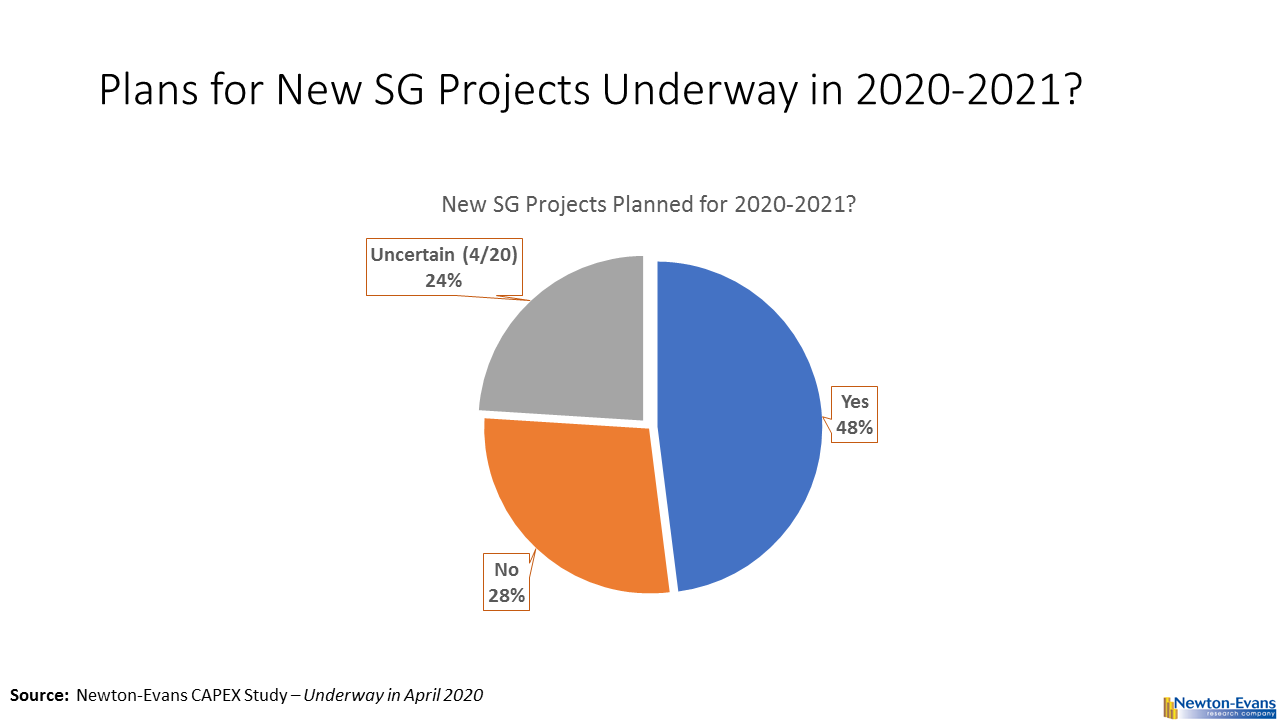
Figure 1 indicates that nearly one-half (48%) of the surveyed utilities continue to have plans to launch new smart grid projects either in 2020 or in 2021.

Figure 1.


Continue reading U.S. Electric Power Utility Capital Investment in Grid Modernization: Effects of COVID-19 Pandemic on Near-Term and Mid-Term Outlook

Posted on

CAPEX Outlook Survey for America’s Electric Power Utilities

If you have insights into your utility’s plans for its near-term CAPEX planning affecting grid modernization projects, we request your help. . Newton-Evans will value your participation in our current study of the capital spending outlook for the nation’s electric utilities in light of the current pandemic.  Newton-Evans will retain your observations in confidence, and will provide you with a complimentary 40-page report of findings gathered from among electric power industry officials located throughout the United States.  The secure online survey is located here: https://www.surveymonkey.com/r/ElectricUtilCAPEXsurvey

Some reasons to participate include:

  • Help industry manufacturers, T&D consultants and systems integration firms prepare to meet the nation’s electric utility demand for equipment and systems during late 2020 and 2021.
  • Provide fellow utility planners to better understand specific grid modernization activities that IOUs, public power utilities and cooperatives are preparing to undertake.
  • Keep up with industry trends by having your own copy of the highly regarded Newton-Evans’ CAPEX report to share with management in mid-May.

A special “thank you” gift is is also available for participants at the end of the 12-question (largely multiple choice) survey.  To date, we have well-thought-out responses in hand from major IOUs, public utilities and electric co-ops.  Looking forward to your survey participation, we thank you kindly for sharing your insights.  We are closing off survey data collection work on Friday, May 15, 2020.


Posted on

Energy Management and Market Operations Systems (EMMOS) Conference to be held in San Diego, California During September 13-16, 2020

April 24, 2020.  The 27th annual three-day conference of the Energy Management and Market Operations Systems (EMMOS) Users Group will be held in San Diego, California during September 13-16, 2020, starting with a welcoming reception at the beautiful Kempton Hotel Palomar, San Diego on the evening of Sunday, September 13.

This year’s conference agenda will feature topical speakers and roundtable sessions, technical training class, a tour of the SDGE control center and vendors’ exhibition.  The conference will be held in conjunction with the OSISoft PI Generation and T&D conference, which is being held during the same week in San Diego.

Featured conference sessions at the 2020 gathering of North American and international control systems and market operations management and staff will include topics such as:  Design Matters, Protection and Control, Block Chain, 5G Networking Applications, Big Data, Grid Analytics, Situational Awareness, and others.  Presentations will be delivered by representatives from IOUs, ISOs, RTOs and the T&D Consulting community.  Please contact Mr. Reza Alaghehband at Reza@emmos.org for proposals and suggestions.

Panel discussion topics: “Contingency Plans for Control Centers Operating Under Emergency Conditions” and “Current and Future Utility Industry Technology Solutions and Challenges”

Technical Tour:  The 2020 conference will include a control center tour and will also feature a micro grid tour.

Vendor Exhibition:  An Energy Management and Market Systems focused vendor exhibition will be held on Monday evening and will include a cocktail and hors d’oeuvres reception.

Training workshop/tutorial:  A 4-hour training workshop on “Power Network Applications and Tuning” will be held as part of the conference.  Participants will receive a certificate of completion.

The annual EMMOS conference attendees include electric power operations officials involved with transmission, distribution, generation, Market Systems, as well as IT managers, planning engineers, consultants, ISO staffs, visualization and situational awareness engineers, and related systems personnel involved with control and/or market systems and substation modernization, distribution automation, outage management and geographic information systems.

The EMMOS website is now open and available for registrations for this September’s conference.

Further information on the upcoming 2020 EMMOS conference, including registration information and hotel booking arrangements can be found on the EMMOS website at www.emmos.org.   Exhibitor opportunity information is available from Mr. Dave McGinnis at davemcginnisalt@yahoo.com .  Recommendations for additional topical presentations are welcomed and should be submitted to Mr. Reza Alaghehband at Reza@emmos.org.

In the event that the conference has to be cancelled, refunds will be made to registrants or optionally can be applied to the 2021 EMMOS conference. In the event that it becomes necessary to cancel the physical conference, we will plan to conduct a live streamed video conference with speakers and roundtable discussions.  The virtual conference would be available to remote attendees at a substantially reduced price.


Posted on

Transmission & Distribution World Partnership with Newton-Evans Research Company

Over the years since the early 1980’s, Newton-Evans’ articles written by Chuck Newton have appeared in more than 60 editions of Transmission and Distribution World.  Recent articles can be found here on the T&D WORLD website: https://www.tdworld.com/home/contact/20973495/charles-w-newtonThe following articles are among those now available on the T&D WORLD website.

Energy Policy and the Impact of Renewables and New Market Participants
Mar 13, 2020. This article is Part 2 of a series on current policy trends, first presented at the Little Rock, Arkansas EMMOS Users Conference in September 2019. Part 1 addressed grid modernization from an energy policy perspective.

COVID-19 Epidemic Impact on Protective Relays and Grid Modernization
Mar 13, 2020. What will be the likely economic consequences to grid modernization plans and budgets now in place, seeing the COVID-19 epidemic disruptions, and even havoc, in a significant number of the world’s industrialized and developing nations?

Grid Modernization from an Energy Policy Perspective in 2019
Nov 21, 2019.  This paper is part of a two-part series on current policy trends, first presented at the Little Rock, Arkansas EMMOS Users Conference in September 2019.

A Researcher’s Perspective on the North American Protective Relay Marketplace
Jun 02, 2019.  Charles Newton, Newton Evans Research Company, offers his observations on a recent survey on the protective relay marketplace.

IEC 61850: A Research Perspective
Jan 25, 2019.  Comparison of the findings of Newton-Evans studies on adoption of IEC 61850 by North American and international electric utilities.

Posted on

Update to 2019 Market Outlook for Protective Relays and Grid Modernization Efforts

Refreshing the Outlook for P&C Investments Specifically and for Grid Modernization

The Newton-Evans study of protective relays that was completed several months ago was based on a 2019 multi-month survey-based study of protection and control engineering department heads and senor staff members at key electric power utilities in 30 countries. A total of 97 utility P&C managers and staff discussed their usage patterns and plans for relay applications, protocols and telecommunications architectures as well as their investment plans for protection and control activities during the field collection phase of the study. In addition to utility surveys, more than 30 industry officials from several protective relay manufacturing firms around the world also participated in the study.

The report series provides updated information on a variety of “universally-applied” protective relay types including generator, transmission line, distribution feeder, transformer and motor protection units.

Estimates and forecasts contained in the 2019-2022 report were premised on five sources of information:

  • In-depth utility surveys and interviews of 98 utility protection and control officials located in 30 countries conducted in 2019.
  • Relay manufacturer surveys and channel member interviews together with available financial information from suppliers.
  • Protection and Control consulting firms in six countries.
  • Excerpts from related multi-client and commissioned studies undertaken and completed by Newton-Evans Research Company.
  • Economic and financial global market outlook information developed by a number of respected public and private sources (e.g., World Bank, UNDP, IMF, Bloomberg, and others).World and Regional Economic Outlook: Implications and Viewpoints for the Protective Relay Market

Continue reading Update to 2019 Market Outlook for Protective Relays and Grid Modernization Efforts

Posted on

Transmission & Distribution World – New Article by Chuck Newton

Grid Modernization from an Energy Policy Perspective in 2019

by Chuck Newton

This article has just been published in the November 21, 2019 online edition of Transmission & Distribution World.  The article is part one of a two-part series on current policy trends, first  presented by Chuck Newton at the Little Rock, Arkansas EMMOS Users Conference in September 2019.  The link to the T&D World article is here:  https://www.tdworld.com/smart-grid/grid-modernization-energy-policy-perspective-2019 .

I hope you find the article informative and helpful in navigating the fairly complex regulatory and policy-making organizations that affect and drive the U.S. electric power industry – affecting utilities, equipment manufacturers, systems and services providers, the engineering consulting community and the many millions of residential, commercial and industrial electric power users.

Kind Regards,

Chuck