Posted on

More Findings from the 2024-2026 P&C Survey and Study

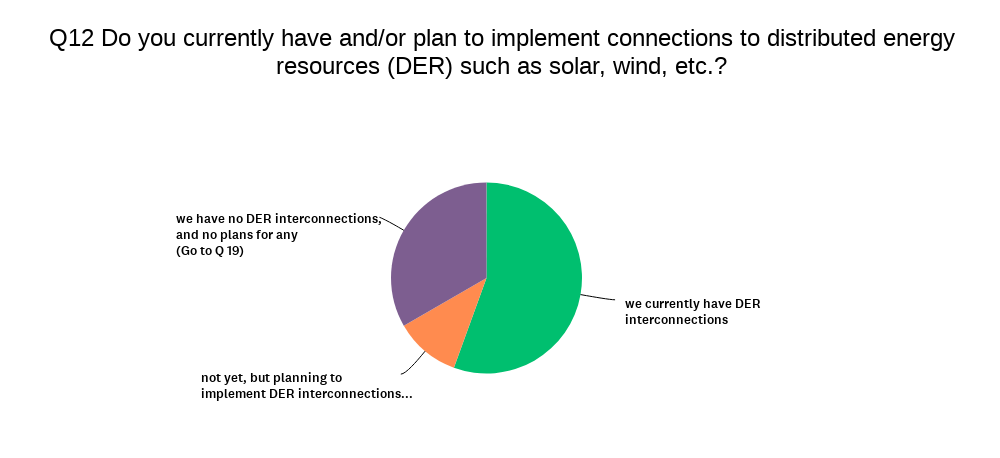
One of the questions asked in this year’s P&C survey concerned utility connections (if any) to distributed energy resources (DERs). As shown below, about 56% of respondents indicated having one or more interconnections to DER installations.  Another one-third stated that they had no connections to DERs nor any plans for such connections.  Eleven percent indicated that the utility plans to implement DER connections by 2026.

Another topic included in this year’s study was to learn more about the methods used, or planned for use, to detect high Impedance Faults (HIFs) on utility distribution systems.  As noted in the accompanying table, nearly three quarters (73%) of respondents indicated reliance on customer notifications to detect HIFs.  About one quarter (26%) cited the use or relays used in conjunction with HIF detection, while more than one half (53%) stated that the use of relays was a method under consideration for HIF detection.  Thirteen percent reported using digital fault monitors, while another 27% were considering use of digital fault monitors.  None of the respondents were using mechanical, pole-mounted HIF detectors at the time of the survey, but 20% were considering this method.

Posted on

Initial Findings – 2024 Study of P&C Usage Patterns and Trends

The initial group of fewer than 30 North American utility survey completions received as of September 18 represent a range of operational P&C methods and procedures as well as plans for electric grid protection and control, centering on protective relays.

Importantly, the initial group has indicated the following:

  • There are many thousands of electro-mechanical relays still in use throughout North American utilities, based on feedback from our initial respondents. In our opinion, that may mean as many as a quarter million e-m units continue in operation within T&D substations.
  • A growing percentage (20-25%+) of the first and second generations of microprocessor relays have been in operation for more than 15 years.
  • By the end of the study, we hope to have a ballpark range estimate of the number of protective relays in use across North America, at least those in transmission and distribution applications. At this point in time, it appears to me that well over 1.5 million units are likely to be installed in North American substations.

There are about 20 additonal topics covered in this year’s survey.  Following are the initial findings, based on fewer than 30 major utilities, but including a few TOP 10 from IOUs, public power utilities, and cooperatives.

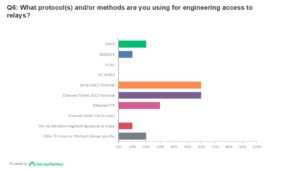
Note in the chart (Q6) that engineering access to protective relays is largely enabled by both serial ASCII terminals and Ethernet Telnet ASCII terminals, following by Ethernet FTP.  This may well change once additional surveys are received.

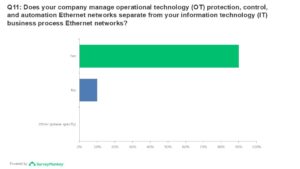
Based on the early survey submissions, it is shaping up that North American utilities are continuing to keep separate the OT (Ethernet) networks from their IT-business process networks, as shown in Figure Q11.

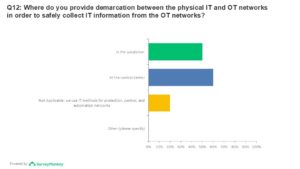
Based on initial feedback, there is no single point of demarcation used by a majority of utilities as shown in Figure Q12.  Tallies for the control center is currently running a bit ahead of the substation as the point of demarcation between physical IT and OT networks in order to safely collect IT information from the OT networks.

Later this week, look for additional findings from our study participants.  If you are involved at least somewhat in P&C or substation engineering work at a North American utility, we invite you to participate in the 2024 survey as your views are important:  https://www.surveymonkey.com/r/3PLYHXG.   

Posted on

HV Substations and Equipment Expenditures Estimated at $11 Billion in 2023


The Newton-Evans HV Equipment Market Overview series of reports for 2024-2026 includes a total of 15 market snapshots or overviews for a variety of HV equipment.  The HV equipment totals for major components of substations and transmission network installation excludes additional billions spent on substation construction activities for both new substations and existing substation upgrades.

An excellent guide to substation project costs is the MISO Transmission Cost Estimation Guide for 2024, which can be found here: https://cdn.misoenergy.org/MISO%20Transmission%20Cost%20Estimation%20Guide%20for%20MTEP24337433.pdf .  This guide provides a wide array of related cost assumptions that include ancillary equipment related costs as well as some estimates of current-year equipment prices and project overhead costs.

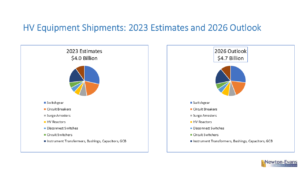
The Newton-Evans’ estimated outlay of expenditures for  U.S. HV substation construction activities reached about $4 billion in 2023, a similar level as was the total estimated spending for all HV equipment categories other than power transformers, which, as a separate category, reached about the $3 billion level.  The estimates shown in Figure 1 includes total estimated spending for HV equipment being purchased in conjunction with new substation developments (bundled procurements) as well as the amounts purchased for equipment retrofits and upgrades in existing substations and network locations (“loose” procurements).

The total estimated spending shares for switchgear shown below includes both air-insulated and gas-insulated types.

Power transformers and P&C topics are treated separately from HV equipment in our market overview series of studies. The entire range of power transformers included in the total costs for HV substations amounted to an additional $3+ billion.  You can read up on U.S. power transformer market estimates here: https://www.newton-evans.com/a-mid-2024-assessment-of-the-u-s-power-transformer-industry/ .  The updated P&C series of market overviews will be published in early Autumn.

A listing of all HV equipment summary reports included in this year’s series of market overviews can be found here: https://www.newton-evans.com/product/overview-of-the-2024-2026-u-s-transmission-and-distribution-equipment-market-high-voltage-series/ .

Figure 1. HV Equipment Market Estimates and Outlook

A listing of all HV equipment summary reports included in this year’s series of market overviews can be found here: https://www.newton-evans.com/product/overview-of-the-2024-2026-u-s-transmission-and-distribution-equipment-market-high-voltage-series/

Posted on

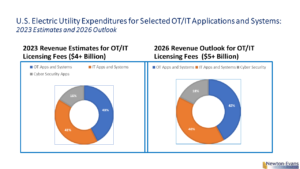
Key OT and IT Applications License Fees Reach $4 Billion Level for the U.S. Electric Power Community

The 2024-2026 “Overview of the U.S. Electric Utility Market for OT/IT Systems” from Newton-Evans Research highlights a significant growth trajectory in the market for operational technology (OT) and information technology (IT) applications within the U.S. electric power sector. Key points from the report include:

Market Size and Growth: In 2023, revenues from software license fees for OT and IT applications surpassed $4 billion, with expectations to reach $5 billion by 2026. This growth reflects the increasing importance and complexity of systems used by electric utilities and commercial and industrial (C&I) firms.

Application Coverage: The individual report summaries include a broad range of systems essential for utility operations and management, including:
Energy Management Systems (EMS)
Supervisory Control and Data Acquisition (SCADA)
Geographic Information Systems (GIS)
Customer Information Systems (CIS)
Outage Management Systems (OMS)
Meter Data Management Systems (MDMS)
Mobile Workforce Management (MWM)
Advanced Distribution Management Systems (ADMS)
Energy Market Management Systems (EMMS)
Generation Management Systems (GMS)
Distributed Energy Resources Management Systems (DERMS)
Control System Security offerings

Investment Beyond Licensing: In addition to the direct license fees, there are substantial soft dollar expenditures related to staffing and equipment necessary for developing, operating, and maintaining these systems. These additional costs can far exceed the hard dollar expenditures on licenses.

Historical Context and Trends:
Historically, large utilities managed EMS and CIS through separate OT and IT departments. The evolution of the industry has led to increased integration and cooperation between these departments, resulting in greater IT/OT convergence by the 2020s.

Market Dynamics:
While some applications have reached maturity and show slow growth, newer systems are experiencing rapid expansion. The competitive landscape includes over 50 major software providers, with an additional 35 companies focused on cybersecurity solutions for the energy sector, particularly for renewables asset owners and operators.

This comprehensive market overview underscores the critical role of both OT and IT systems in modernizing and optimizing electric utilities, highlighting ongoing trends and future growth areas in the sector. The OT-IT series of 12 reports can be ordered and downloaded here: https://www.newton-evans.com/product/overview-of-the-2024-2026-u-s-electric-utility-market-for-ot-it-systems/.

Posted on

A Mid-2024 Assessment of the U.S. Distribution Transformer Industry

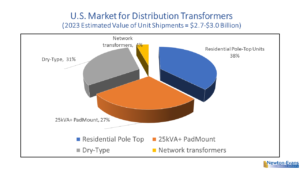
This overview provides a comprehensive look at the distribution transformer market in the U.S., highlighting its complexity, key players, and market dynamics. The article includes four sections covering the major classifications of distribution transformers as used in the U.S.  These include overhead pole-mount distribution transformers, dry-type units, pad-mount transformers and network transformers. 

One of the salient points in assessing the distribution transformer market is in the composition of key industry participants.  Unlike the leaders in power transformer manufacturing, which are global or at least multi-national in scope and scale, there are multiple important North American-based manufacturers of one or more types of distribution transformers.  This group of industry leaders includes significant sized North American companies. Howard Industries, ERMCO and Central Moloney – are leading U.S. firms, while Hammond Power Solutions and Carte International are Canadian-based, with both enjoying an increasingly important presence across the U.S. market.

The leading world-class power transformer manufacturers including Prolec-GE, Hitachi Energy, and Siemens Energy also certainly have a stake in one or more segments in this multi-billion-dollar portion of the electrical transformer industry.

A liquid-filled Distribution Transformer for this article is an oil-filled, overhead, pole- mounted transformer of 5 kVA or higher. Most of the estimated 45 million or more distribution transformers in the United States are liquid-filled and most are single-phase, overhead installations.  By 2022, these amounted to more than one million units of annual production (Newton-Evans’ estimates). The 2023 market, while continuing to churn out more than one million units per year, had been hampered by long lead times, capacity limitations, material shortages, and changing FERC/DOE specifications.  Nonetheless, the demand for these units continues to increase in mid-2024 as new housing units develop in an ongoing moderately strong economy and as millions of older units are scheduled to be replaced over the next few years.

With the market demand for overhead residential distribution transformers running at about 1,100,000-1,250,000 units per year, the median prices have been increasing each year, due to the cost of materials, capacity limitations and supply channel issues.  For pad mount and three-phase units, recent sample bid price ranges are listed in the available market overviews comprising the Newton-Evans transformer market overview series https://www.newton-evans.com/product/overview-of-the-2024-2026-u-s-transmission-and-distribution-equipment-market-transformer-series/ .  Average life span for 1-phase overhead units is 30-34 years, depending on climate and location.  Some further observations include these:

  • The majority (70-80%) of distribution transformers are sold directly from manufacturers to large utilities/end-users (IOUs and industrials) while mid-size municipals and co-ops tend to purchase via reps and distributors.
  • Newton-Evans estimates that there are about 30-40 American utilities requiring at least 10,000 replacement pole-top units per year, and another 50 or so utilities that require at least 5,000 replacement units per year.
  • Howard Industries, a co-leader in oil-filled distribution transformers, has a formidable competitor in the combined ERMCO family of distribution transformer manufacturers, which includes Power Partners, Pioneer Transformers and Jefferson Electric, as well as the large oil-filled distribution transformer business of the ERMCO Transformers unit.

A dry-type distribution transformer is considered to be a single phase or three-phase unit installed primarily at indoor locations of commercial and industrial sites. Price variations are significant, dependent upon these factors: kVA rating, 1p or 3p unit construction; primary and secondary voltage level; number of taps, temperature variance; frequency, type of windings, type (ventilated or encapsulated), sound levels, electrostatic shield requirement; K-factor and quantities.

Although there are no dominant suppliers in this segment in the USA, at least six companies, led by Hammond (HPS) have a double-digit share of this nearly $900 million-dollar market (Newton-Evans estimate). Other key suppliers include Hitachi Energy, Eaton, Schneider Electric, Prolec GE and Siemens Energy.  On a worldwide basis, it is likely that Hitachi Energy is the market leader, with an estimated $750-$800 million in sales of dry- type transformers of small, medium and large power units (up to 63 MVA).

As a side note, a U.S. Department of Energy study released in late 2021, reported 2019 sales of about $716 million paid for several hundred thousand dry-type transformers, the majority of which were low voltage units.  That same heavily redacted DOE study indicated only six suppliers accounted for the majority of dry-type unit sales.  Other suppliers with at least a 1%-3% share include: Olsun, MGM, WEG, FedPac, Howard, Hubbell ACME, ELSCO, Sunbelt-Solomon (Newton-Evans observations).

A liquid-filled, pad-mounted Distribution Transformer is a pad-mount transformer of 25 kVA or higher. A significant portion of three-phase liquid units are pad-mounted outdoor installations. More than 65,000 three-phase, liquid-filled units were likely sold in 2023 (Newton-Evans estimate). Utilities purchase pad mount units for stock/inventory as well as for immediate installation. At least four manufacturers are believed to have earned $100 million or more in 2023 sales of residential pad mount transformers (Newton-Evans’ estimates).  Key manufacturers include Howard industries, ERMCO and Central Moloney along with the larger multinational firms, including Eaton CPS, Prolec GE and Hitachi Energy.

The price range for pad-mounted distribution transformers vary significantly year-to-year, due to price fluctuations in the commodities markets for copper and steel.  Typical price ranges found on bid tally sheets vary from about a low of $4,000 to a high end of about $40,000 – with price depending upon quantity and kVA ratings requirements.  Utilities having blanket agreements with suppliers tend to obtain significant discounts from the open bid prices we have listed in the market overview series of reports.  The pad-mount portion of distribution transformer shipments is more than one quarter of the total value.

Network transformers are high-end distribution transformers that serve underground grid and spot networks, and these are large three-phase units. The New York City (ConEdison) and suburban New Jersey areas (PSEG) together account for about 40-50% of all U.S. network transformer installations.

Network transformers are normally vault-types or subway types, which are defined in ANSI C57.12.40-1982: Vault-type transformers are suitable for occasional submerged operation while subway-type transformers are suitable for frequent or continuous sub-merged operation

Network transformers are also used in large buildings, usually located in the basement. In these, vault-type transformers may be used (as long as the room is properly built and secured for such use).  Utilities may also use dry-type network transformers and related units with less flammable insulating oils.

Sources:  https://electrical-engineering-portal.com/network-distribution-transformers-serving- grid-and-spot-networks/  and Newton-Evans Research – 2020/2022 Studies:  See related article here https://www.newton-evans.com/network-transformers-linchpins-for-underground-electricity-distribution-networks/

The U.S. network transformer market is oligopolistic in nature with only four major suppliers (Carte International, Hitachi Energy, Prolec GE and Pioneer-ERMCO) and four minor suppliers (HPS, Howard Industries, Fed Pac and Maddox) that together produce and ship between 1,400 and 1,900 3p and 1p units each year (Newton-Evans estimates).

More information on our individual transformer report summaries found in this year’s  edition of Overview of the 2024-2026 U.S. Transmission and Distribution Equipment Market: Transformer Series  can be found here: https://www.newton-evans.com/product/overview-of-the-2024-2026-u-s-transmission-and-distribution-equipment-market-transformer-series/ .  

These report summaries each provide an external, nuanced view that can be helpful to manufacturers, end-users, consultants and channels partners in their product and market planning  activities.

Our planned August article will take a look into the substation modernization and automation market, summarizing some findings reported in the just-released series of market overviews located here: https://www.newton-evans.com/product/overview-of-the-2024-2026-u-s-transmission-and-distribution-equipment-market-substation-automation-series/.

Posted on

A Mid-2024 Assessment of the U.S. Power Transformer Industry

Two groups of transformer manufacturers are active in the U.S. electric power industry.  This month’s article will look into the power transformer side of the industry.  Later this month, we will feature an assessment of the multi-billion-dollar distribution transformer market, led by another group of equipment manufacturers.

Large power transformer manufacturers include the global Big Three equipment suppliers to the electric power industry (Hitachi Energy, GE, Siemens), along with specialist power transformer manufacturers including Virginia Transformer, Delta Star, Pennsylvania Transformer, HICO, Hitachi, WEG and Hyundai.

Here are some “definitions” we use for power transformer classifications, based on MVA ranges.

  • A small power transformer is a single phase or three phase unit ranging from 65 kV to 145 kV (U.S. Department of Energy definition) and range up to about 30 or 40 MVA. There are four major manufacturers with each having at least a 10% share of this market segment.  These four together account for about 65% of the value of small power transformer shipments.  Several additional important market participants are active in the U.S. market for small and small-medium power transformers.
  • A medium-to low-end-large power transformer is a unit that ranges from 30-100 MVA. Six major suppliers (Hitachi Energy, Siemens, Hyundai, VA/GE Transformers, Delta Star and Prolec-GE-SPX) share 70+% of this estimated multi[hundred million dollar segment of the U.S. power transformer market.
  • A very large power transformer (VLPT)  as defined is a unit that ranges from 251-400 MVA. Four major suppliers including Hitachi, Hyundai, Siemens and Prolec-GE share more than two-thirds of this estimated multi-hundred-million-dollar segment of the U.S. power transformer market.
  • An extra-large power transformer (XLPT) for this report is a unit that ranges upward from 400 MVA. Three major suppliers including Hitachi, Siemens and Prolec-GE share nearly 60% of the XLPT market in the United States. By 2022, Newton-Evans estimates that sales of XLPT units were growing nicely.  XLPT units are purchased by EHV/UHV transmission utilities and a few industrials that together comprise this segment of the U.S. power transformer market.  Importantly, HICO, Hyundai and Pennsylvania Transformer (acquired by Quanta Services in Nov 2023) have increased their market standing in the large and very large power segments over the past few years.

The Power Transformers market in the U.S. was estimated by one research firm at US$6.9 Billion in the year 2021.  https://finance.yahoo.com/news/global-power-transformers-market-reach-115800430.html?fr=yhssrp_catchall . The Power Transformers market in the U.S. was estimated at US$5.2 Billion in the year 2022 by another research firm.  https://www.researchandmarkets.com/reports/2498175/power_transformers_global_strategic_business.  A third research firm, GMI, reported a U.S. combined power and distribution transformer market of $11.2 Billion in 2023, growing at 7.8% annually through 2032.  https://www.gminsights.com/industry-analysis/us-transformer-market  .  Most observers, including Newton-Evans Research, believe that the U.S. accounts for about one quarter of total world demand for power transformers.

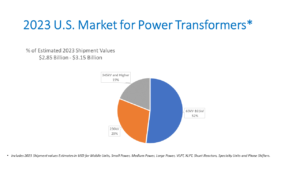
Shipment values of power transformers from 30 MVA and up were around $3 Billion in 2023, according to Newton-Evans’ own findings. Two major suppliers participating in our annual study indicated that 2023 large power transformer sales were close to $2B by year-end for 2023 and will be “well above” $2B in 2024.  The Newton-Evans’ chart below shows what the firm believes is the dollar value range of actual unit shipments of power transformers for 2023.  The “bookings level” for 2023 and for the next few years is well above these estimated shipment values, due in large part to the extended lead times for unit delivery of power transformers.  Wood-Mackenzie recently wrote on the issue of long lead times for power transformers. https://www.woodmac.com/naws/opinion/supply-shortages-and-an-inflexible-market-give-rise-to-high-power-transformer-lead-times/

about $3
Renewable projects that were released 2-3 years ago and for which transformers are now getting ready to ship don’t always have a “home” ready to accept the power transformers. In some cases, at least one manufacturer has been delivering client transformer orders to a warehouse or other storage location. Some renewables developers have a growing inventory of ‘unused’ power transformers, and we believe this may impact future demand as this could result in increasing cancellations of active “build” projects.

Shunt reactor orders are increasing as well, as many of the renewable sites have installed, or will install, shunt reactors. Newton-Evans believes that it is likely that the majority of demand for these shunt reactors will be of the variable type, rather than fixed type units, especially so for offshore wind projects.  Other equipment included in the Newton-Evans series of power transformer market overviews include mobile transformers, phase shifting transformers and specialty transformers (including arc, furnace types) for industrial use.

Impact of ER and BESS:  With the growth of distributed energy resources and energy storage across the country, there will be increasing demand for small/low power transformers over the five-year outlook period (2024-2029), especially with the emphasis on a green energy economy within the Biden administration.  This could all change (perhaps dramatically) depending upon the outcome of the 2024 national election.

Already in 2024, the U.S. has gained promise of much-needed additional power transformer capacity, with the February announcement from Siemens Energy that it will construct its first large power transformer plant in the U.S. (Charlotte, NC).  A second announcement in June came from the Italian firm, Westrafo, for a new large power transformer plant to be constructed in the greater Dayton, Ohio area.   Both plants expect to be in full production within 36 months.

Look for our next article providing an assessment of the U.S. distribution transformer market by the end of July.

More information on our individual transformer report summaries found in this year’s  edition: Overview of the 2024-2026 U.S. Transmission and Distribution Equipment Market: Transformer Series  can be found here: https://www.newton-evans.com/product/overview-of-the-2024-2026-u-s-transmission-and-distribution-equipment-market-transformer-series/ .  

These report summaries each provide an external, nuanced view that can be helpful to manufacturers, end-users, consultants and channels partners in their product and market planning  activities.

Posted on

Four New Series of 2024-2026 Market Overviews Now Available

The following four series of U.S. Market Overviews (2024-2026) are now available for online purchase:

High Voltage Series   Complete HV Series Price: $1,450.00

HV01 – FACTS and RPC                                     HV02 – HVDC

HV03 – Air Insulated Substations                 HV04 – Gas Insulated Substations

HV05 – Air Insulated Switchgear                  HV06 – Gas Insulated Switchgear

HV07 – High Voltage Bushings                       HV08 – High Voltage Capacitors

HV09 – High Voltage Circuit Breakers         HV10 – HV Disconnect Switches

HV11 – High Voltage Circuit Switchers        HV12 – HV Instrument Transformers

HV13 – Air Core Reactors                                  HV14 – HV Surge Arrestors

HV15 – Generator Circuit Breakers

Power and Distribution Transformer Series    Complete Transformer Series Price: $1,450.00

TX01 – Mobile Transformers                                           TX02 – Medium Power Transformers

TX03 – Med-Large Power Transformers                     TX04 – Large Power Transformers

TX05 – Very Large Power Transformers                       TX06 – Shunt Reactors

TX07 – Special Transformers (Arc, Furnace)             TX08 – Distribution Transformers (OH, Oil, 5kva+)

TX09 – Distribution Transformers (Dry Type)          TX10 – Distribution Transformers (Pad Mounted)

TX11 – Network Transformers                                       TX12 – Phase Shifting Transformers

TX13 – Transformer Life Cycle Management  Svcs        TX14 – Transformer M & D

Control Systems and Services (OT/IT)  Series    Complete Control Systems (OT/IT) Series Price: $1,450.00

CS01 – EMS Systems Integration                                          CS02 – Distribution SCADA

CS03 – Geographic Information Systems                          CS04 – Customer Information Systems

CS05 – Outage Management Systems                                CS06 – Meter Data Management Systems

CS07 – Mobile Workforce Management Systems           CS08 – Advanced Distribution Automation

CS09 – Electric Power Market Management System    CS10 – Cyber Security Software for Control Systems

CS11 – Generation Management Systems                       CS12 – Distributed Energy Resource Systems

Medium Voltage Series  Complete MV Series Price: $1,450.00

MV01 – Air Insulated Metal Clad Switchgear         MV02 – MV Motor Controllers

MV03 – MV Gas Insulated Switchgear                       MV04 – Automatic Circuit Reclosers

MV05 – Outdoor Distribution Circuit Breakers     MV06 – Load Interrupter Switchgear

MV07 – Overhead Disconnect Switches                  MV08 – Sectionalizers

MV09 – Fused Cutouts                                                   MV10 – Pad Mounted Switchgear

MV11 – Submersible Switchgear                              MV12 – Bus Duct and Bus Bar

MV13 – Sub Class Pad Mounted Capacitors        MV14 – Current/Instrument Transformers

MV15 – Fault Current Limiters                                  MV16 – Fault Current Indicators and Faulted Circuit Indicators

MV17 – Current Limiting Fuses and Fuse Links  MV18 – Surge Arresters


The following three topical series of U.S. Market Overviews are scheduled for availability as follows:

July 2024  Substation Automation Series:  Complete Series Price: $1,450.00

SA01 – Remote Terminal Units                                       SA02 – Programmable Logic controllers

SA03 – Substation Automation Platforms                 SA04 – Multifunction Meters and Recorders

SA05 – Inter-Utility Revenue Meters                            SA06 – Digital Protective Relays

SA07 – Digital Fault Recorders                                      SA08 – Sequence of Events Recorders

SA09 – Power Quality Recorders                                   SA10 – Substation Reclosers

SA11 – Subs Automation Integration Services      SA12 – Substation Communications

SA13 – Substation Voltage Regulators                     SA14 – Substation Precision Timing Clocks

August 2024   Distribution Automation Series. Complete Series Price: $1,450.00

DA01 – Automatic Circuit Recloser Controls   DA02 – DA/DMS System Components

DA03 – Voltage Regulators                                       DA04 – Capacitor Bank Controllers

DA05 – Fault Indicators                                              DA06 – Pole Top RTUs

DA07 – Line Mounted Monitoring Devices         DA08 – Communications Components for DA

DA09 – Engineering Services for DA

September 2024  Protection and Control Series: Complete Series Price: $1,450.00

 PR01 – Feeder Relays                             PR02 – Line Differential Relays

PR03 – Generator Relays                       PR04 – Motor Control Relays

PR05 – Electro-Mechanical Relays     PR06 – Drop-In Control Houses

PR07 – Synchrophasors                         PR08 – Teleprotection


Posted on

Historical Perspectives on Energy Management Systems Usage in American Electric Power Utilities

An Energy Management System (EMS) is a suite of generation and transmission applications software tools used to monitor, control, and optimize the performance of generation and transmission systems. Energy management systems are designed to reduce energy consumption, improve the utilization of the system, increase reliability, and predict electrical system performance as well as optimize energy usage to reduce cost. Over the past 40 years and more, I have been able to visit EMS installations in many states and in several other countries. Each site visited was somewhat unique in style, size, operational set-up and wall displays.

From the late 1960’s until the early 1990’s, energy management systems were highly customized for many of the 200 large American utilities (then mainly IOUs involved with vertically integrated operations) that required the capabilities offered by such technology as was available in that era. Several of these early systems were developed with precursor versions of today’s “digital twin” technology in the form of an operator training simulator which mimicked the real-time operational energy management system.

Early Days
Control Data Corporation (Minnesota) had been a leading supplier of EMS mainframe hardware platforms and systems to U.S. utilities through most of the 1970’s, with computers from Harris Corporation (Florida), IBM (New York) and GE (Arizona) also supplying mainframe and early minicomputers to serve as the platforms for early EMS applications. Early international EMS suppliers, like Westinghouse UK, ABB, Areva and Siemens were instrumental in supplying systems used in Western Europe, Asia and South America and in a few African countries (South Africa primarily). Some of these suppliers used international computer manufacturers including the French company, Groupe Bull (Honeywell Bull)

The era of “forklift” system replacements occurred for 30 years or more after the introduction of large EMS installations, at least through the first two generations of systems.
Vendor switches occurred among many of the first- and second- generation systems users, meaning hardware and software were both to be replaced with third and fourth generation systems available during the 1990s through 2010 era. These third-generation systems became available from start-up firms led by ESCA (Washington) and OSII (Minnesota) as well as from the principal global EMS suppliers like ABB, GE and Siemens – all active EMS market participants in North America. Moore Systems (Texas) also developed EMS capabilities. ESCA became a key business unit of Areva T&D, while OSII remained independent until its recent acquisition by AspenTech (and AspenTech’s parent, Emerson), finalized in 2022.

There were also a few custom systems developed during the late 1960’s to early 1970’s by defense and aerospace firms. Consolidated Edison procured a system developed by Boeing Corporation, using IBM 360’s as platforms. The Canadian aerospace firm CAE developed an early EMS for PSEG in New Jersey and another for Grant County PUD in Washington state.

In 1997, GE and Harris Corporation (another aerospace/telecom equipment firm) had formed the GE-Harris Control Systems business based in Melbourne, Florida. A few years later, CAE sold its interests in utility control systems to another large Canadian firm, SNC Lavalin. In 2010, SNC Lavalin’s Energy Control Systems business was sold to GE. During the 1990’s, the French firm Areva T&D became a global market participant with its wide range of e-terra control systems and infrastructure offerings. The company’s electric power business units were first divided up and sold to Alstom and Schneider in 2009. By 2015, GE had acquired Alstom’s electric power business units, including the popular e-terra system offerings.

Minicomputers take over
During the late 1970’s and early 1980’s mainframe computers were being replaced as EMS platforms by minicomputers, led by offerings from Digital Equipment Corporation (DEC) and Hewlett-Packard (HP). Modcomp, Gould, Data General, Prime Computer and a few others were also providing SCADA systems platforms to early SCADA systems developers like ACS, QEI, Tejas Controls, Telegyr (L&G) and several others from 1975 onward.

Restructuring the Power Industry
During the late 1990’s and onward, many states had required major investor-owned utilities to separate (unbundle and restructure) generation operations from T&D operations. ISOs and RTOs were put in place nationwide just before the turn of this century and oversaw interstate transmission operations in conjunction with the 200 or so utilities owning transmission assets. By 2019 EMS vendors were taking note from the ADMS community and began using the term “advanced energy management system” (AEMS) to indicate significant new EMS capabilities including the integration of renewables and energy storage and their impact on grid operations and voltage stability. Coupled with the rapidly increased speed of processing and analyzing contingencies, and improving the ability to dispatch and curtail distributed energy resources, these developments have helped enhance operator capabilities and visibility into the real-time electric network.

As the power generation mix and transmission requirements have become more complex, AEMS developments and capabilities are keeping pace with such needs. The impact of artificial intelligence will continue to provide human operators with more and better information and will likely become a discriminator among the key AEMS market participants. Recently, generation management systems (GMS) have been developed that now include many of the generation-side applications that were (and continue to be) components of an EMS as described in our market overview report on GMS.

EMS/AEMS Components
Three major components of a modern EMS include:

  1. Native Services: data acquisition and control; graphical user interface; linkage/connectivity options to other systems; large database capabilities. There are many objectives of an energy management software including an application to maintain the frequency of a Power Distribution System and to keep tie-line power close to the scheduled values.
  2. SCADA Services: load shedding, load restoration, network status; sequential control, switch order management, playback of historical events.
  3. Advanced Power Systems Applications (or Network Application Services): to include generation dispatching and control [AGC], transmission security management; voltage transient stability; unit commitment; state estimation contingency analysis, demand forecast, and dispatcher training simulator).

Factors affecting current period activities in the EMS/AEMS market include improvements in linkages to external systems (ISO/RTO MMS, AI-enhanced analytics, ADMS, energy storage systems, DERMS, WAMS) as well as new capabilities to react to NERC/FERC changes in bulk power regulations, transmission monitoring (DLR), cyber security guidance, visualization software, intelligent alarm processing, renewables integration linkages) also provided by third party firms such as ETAP, Nexans, OATI, CYME, Milsoft and others.

Newton-Evans’ 2024-2026 Market Overview Series on OT/IT Systems
The values of EMS software provided by such suppliers to EMS installations are estimated in the OT/IT series of market overviews, as well as is the overall EMS domestic market size and market trends. Related to EMS in the Market Overview series on OT/IT systems, market management, GIS, CIS/CRMS, OMS, GMS, SCADA/DMS, ADMS, DERMS and cyber security software are also provided. These topics are each treated separately in the 2024-2026 series of OT/IT market overviews just released by Newton-Evans. More information on the OI/IT series can be found here: https://www.newton-evans.com/product/overview-of-the-2024-2026-u-s-electric-utility-market-for-ot-it-systems/.

Article Sources: OSII, PSC Consulting, Schneider Electric, GE Vernova, ETAP, Hitachi Energy, Siemens Energy, Schneider Electric, Newton-Evans archived files.

Posted on

A Look at the U.S. Medium Voltage Electric Power Equipment Services Market

The total MV services market is very large – possibly in excess of $15 billion. This larger view of the MV services market encompasses multiple segments such as field and in-plant equipment maintenance and refurbishment; construction-related services for distribution substations and MV under-grounding activities; training classes for utility/C&I engineering and operations staffs; site analysis and permitting for distribution utilities and renewables projects; and MV equipment testing services, including commercial test labs and field service diagnostics and testing firms. In addition, vegetation management and telecommunications services are both very large power utility-related businesses in their own right, with significant portions of segment revenue obtained from medium-voltage projects, and these topics will be covered in articles later in 2024.

U.S. Medium Voltage Equipment Services
The U.S. MV equipment services market itself is very large (>$4 billion is our estimated minimum market size) in total, comprised of at least three major sub-segments and is served by hundreds of national, regional and local-area electrical equipment service providers.

While much of MV equipment services growth for third party firms seems likely to be in the 3-5% range, there are a few areas that may see larger increases in revenues, including the upper MV ranges of switchgear, along with gas-insulated units and underground equipment. As well, transformer maintenance, repairs and retrofits are commanding more attention and relying on third party services as new transformer prices, product availability and long lead times affect grid reliability.

Numerous MV Maintenance Market Participants
In multiple research studies conducted over several decades, Newton-Evans Research has found more than 275 U.S.-based companies and organizations provide one or more types of MV equipment-related services to electric utilities and to C&I customers. Each of these was earning related revenues of at least $10 million in annual revenue, with about 45-50 firms in the group earning in excess of $20 million annually from the provision of MV-related services. There is a growing group of domestic firms earning in excess of $250 million in MV services revenue. Another large segment of commercial providers offers services in addition to equipment maintenance, repair and refurbishment. These include utility staff training services, equipment testing services and some portion of construction related (design/build) services.

When it comes to MV equipment services, two product categories account for the lion’s share of segment revenue. These are switchgear/circuit breaker and distribution transformer equipment services.  Let’s take a closer look at these.

MV Switchgear Services Revenue Assumptions based on Third Party Service Firm Website Information
Switchgear services (maintenance, repair, refurbishment and re-manufacturing) are often grouped with similar Circuit Breaker services and together account for several hundred million dollars of utility and C&I expenditures. There are national, regional and local area third-party T&D services firms that provide various levels of equipment services for utilities and the C&I communities. Some of the national names prominent in the switchgear services, maintenance and repair/refurbishment market include Shermco, CBS Services and Saber Power Services.

While many services firms are in the “small business” category and earn less than $10 million annually, there are several others that earn in excess of $100 Million from a variety of T&D equipment service offerings.

Distribution and Power Transformers
While Newton-Evans estimates as much as $900 million is spent annually on electric power transformer services and replacement parts, the majority of this amount goes for power transformers. Nonetheless, there are several firms that specialize in service and repairs for pole-top and pad-mount distribution transformers. Among the large firms that service, repair and refurbish transformers of all sizes and offer nationwide services, include companies such as IPS, Sunbelt Solomon, RESA and others. A number of smaller firms specialize in maintenance, repairs for distribution transformers at a regional level, including Northeast Power, UTB Transformers and Valley Transformers, Inc.

Twenty years ago, a Newton-Evans survey found that many utilities did not bother with repairs to, nor did they consider third party maintenance, of pole-mount distribution transformers. Unit replacement was easier and faster than was rework and repair. At that time, manufacturing capacity for pole-mount units was sufficient to meet domestic U.S. demand, and lead-times were quite short, compared with today’s market. Most electric power utilities had been able to procure and store scores or hundreds of spare pole-top units for emergencies or time-based replacement up until the COVID years.

All Other MV Equipment Services: The third arm of MV equipment services we consider to be comprised of “all other” equipment of significant cost – that is, costing multiple thousands of dollars. Based on a small sample utility survey conducted during late 2023, it appears that relatively low-cost equipment including reclosers, sectionalizers, fuse links, distribution line monitors, fault current limiters, surge arresters and MV capacitors were very likely to be replaced rather than repaired.

Our next article on MV Services will focus on construction-related services for distribution substations and MV undergrounding activities; training classes for utility/C&I engineering and operations staffs; site analysis and permitting for distribution utilities and renewables projects; and MV equipment testing services, including commercial test labs and field service diagnostics and testing firms.

Keep in mind if you need to have an understanding of the U.S. medium voltage equipment market, our report series of two to four page U.S. market overviews, covering 17 MV equipment types, may be helpful to you. The link for for further information and to place an online order is here:
https://www.newton-evans.com/product/overview-of-the-2024-2026-u-s-transmission-and-distribution-equipment-market-medium-voltage-series/

Posted on

A Janus View of the T&D Equipment, Systems and Services Market at year-end 2023. A Look Back and A View Forward for the Energy Transition in the United States

Looking back over the past 24 months, we initially note what appears to be strong growth in real unit demand for a wide variety of T&D equipment, energy automation systems and related T&D services. Most of this view developed as a result of utility and manufacturer surveying conducted over the past two years.  Along with this perceived increase in demand came higher prices and longer lead times after receipt of order by electrical equipment and device manufacturers – affecting the delivery of operational equipment, T&D-related systems and software, and the provision of related services.  So, the difficulty comes in trying to differentiate rising end-user dollar expenditures versus rising demand in units of equipment ordered or numbers of systems and services provided.

Higher prices for electrical equipment, automation real systems and T&D services accelerated in the post-COVID era, due primarily to increased costs of materials, ongoing staffing issues (and salary increases), supply chain logjams and, to some degree, slowdowns in the regulatory approval process at federal and state levels.

Separating “real” market growth from increased market values due to inflationary price pressures is often difficult, but surveying both side of the electric power equation to include end-users (e.g. utility + C&I) and industry (manufacturers, energy automation system developers and T&D equipment service providers) enable one to work through this inter-related set of activities to determine real market growth.

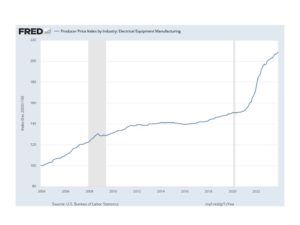
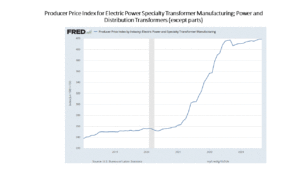
We tend also to rely on FRED (aka Federal Reserve Economic Data) data prepared by the Federal Reserve Bank of St. Louis and sourced from the U.S. Bureau of Labor Statistics that includes historical and current price trends for an array of electrical equipment.  As shown in the following chart, FRED, as of December 2023, depicts trends for large increases in equipment costs, exacerbated by the COVID-era disruption to the economy, and its effects on the typical economic cycle of capital equipment procurements.

Now,  look at the even more drastic manufacturing cost increases for transformers


Reviewing these two charts suggests that end-users of capital electrical equipment are spending more because of rising prices.  However, there is more to this story.  The revenue increases accruing to manufacturers, systems integration firms and T&D service organizations indicate that sales for these firms are moving up, rising faster than inflation, meaning true growth in spending is occurring on orders for additional new equipment and systems and replacement of aging capital equipment and legacy systems.

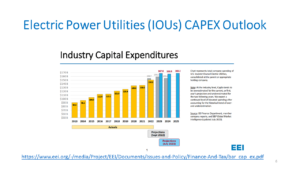
We are seeing growth in unit sales for a variety of equipment and systems and a surge in demand for large power transformers.  On the HV side, there is clear evidence that increased procurements have been the case throughout the country for many capital items.  A review of EEI’s current CAPEX outlook for IOUs indicated a likely rise from 2022 to 2023 of 10%-11% or so.   For transmission, there would likely have been even more growth overall, but delays with renewables projects, transmission permitting issues, and, to some extent, the delays being encountered with large power transformer orders, prevent even more significant transmission interconnection-related growth.  (Click on the chart to expand the view).

As to specific growth areas related to HV or transmission-related capital equipment, it is interesting to observe that the United States continues to invest heavily on equipment manufactured for the lower HV ranges as has been the situation for the nearly four decades that Newton-Evans has studied this market.  Upgrades to existing transmission networks will mean growth in the EHV and UHV ranges, but it has been a slower upgrade process than was the outlook a decade ago.

In the HV equipment manufacturing arena, there are a relative handful of market participants, with most being global or international firms with the capital reserves necessary to finance multi-million-dollar equipment development and manufacturing costs.  This is quite a different picture from the more numerous domestic manufacturers found in most MV or distribution categories of utility infrastructure equipment.  As well, there are only about 200 utilities having any transmission assets, and a 10x multiple of utilities providing electricity distribution services throughout the United States.

As a result of an increased number of suppliers competing for equipment orders in the MV equipment range, we see a moderation of inflationary pressure and lower levels of price increases among distribution equipment manufacturers, lower levels than are apparent among the fewer transmission equipment and large power transformer suppliers.  Lower-cost-based manufacturers of MV equipment can remain competitive, especially when” price” is the basis for procurements, as it most often is among public power utilities, given product quality remains acceptable and is IEEE/ANSI standards-compliant to end-user buyers.

In addition to the annual capital expenditures for new T&D equipment, there is a flourishing after-market for third party T&D services of all types.  There are hundreds of local and regional firms capable of providing services to a wide range of T&D equipment, and scores of these that can provide field-based or in-plant repairs and refurbishments to transformers, switchgear, circuit breakers and the like.  The American trade organization for larger T&D equipment services providers is PEARL (Professional Electrical Apparatus Reconditioning League).  PEARL is comprised of 61 national and regional T&D equipment refurbishment and service firms.  Annual revenues among these member companies total well more than a billion-dollars.

A second association of electrical apparatus services firms is the Electrical Apparatus Service Association, Inc. (EASA) is a U.S.-based, international trade organization of more than 1,700 electromechanical sales and service firms in nearly 70 countries. EASA members sell and service industrial electric motors and related rotating apparatus such as generators, pumps, fans, compressors, gearboxes and blowers. EASA members also provide services for a wide range of T&D equipment, including transformers and switchgear.

Another newer electrical equipment services association is KNOWER, with U.S. members found across the country.  While member capabilities center on electrical motors and rotating apparatus, these member firms also provide testing, repair and maintenance for switchgear, relays, and transformers.

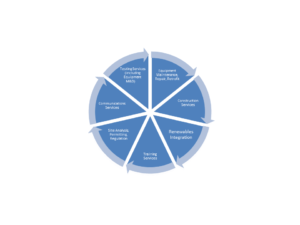
While PEARL members tend to provide excellent services coverage for utilities and C&I firms, EASA and KNOWER tend to focus on the industrial end-user communities, with a focus on electric motors, pumps and the like and provide services to water utilities.  The reason I have included an overview of T&D services firms and organizations in this “look-ahead” article is this.  As the involvement of more third parties in the process of generation and transmission of electric power continues to increase, there will be a corresponding increase in reliance on equipment service providers that are already well-versed in serving the C&I community.  The C&I sector is expanding to include renewable site asset owners together with the site-specific wind plant and solar farm operators.  Together, these sites are adding multiple thousands of units of T&D equipment and a hundred or more new substations to the evolving grid each year.  Click to expand the view of my T&D services wheel.

Next month, I plan to write about the various building blocks of activities that encompass a broader view of T&D equipment services, from training and testing, to equipment monitoring and diagnostics.

Posted on

Cybersecurity and Cyber Crime in the Energy and Utilities Industry


On the front lines of cyber security imperatives and OT/IT concerns are the world’s energy industry companies and utilities.  Energy-related companies and utilities in each sector – electricity, gas and oil and water communities face serious cyber challenges on a routine but persistent basis throughout production, transmission and distribution activities.  Because these communities and the infrastructure they represent are so vital to modern civilization, they are most often targets for bad actors, whether the bad actors are rogue nation-states, criminal groups or hacktivists.

Added to the attractiveness of these infrastructure industry segments for cybercriminals is the ever-growing attack surface that is a result of two things: rapid deployment of field automation, extending the purview of operational control systems to distribution beyond traditional “fences” using less secure wireless communications methods, compared with wire-line approaches to data communications.  As the world modernizes and automates its infrastructure delivery methods, it does so while cyber security standards, checks and balances lag and while regulatory oversight sometimes languishes.

It seems the faster we move toward full-scale automation, the “behinder” we are with cyber-physical security implementations.  Cybercrime reporting is still in its infancy relative to the level of cybercrime events.  Cyber-criminal law needs to be strengthened and severe penalties enacted on a global basis so that strong deterrents will work effectively in the future.

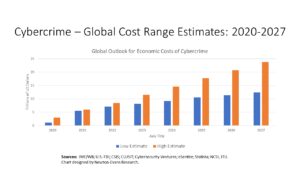
The economic costs associated with cybercrime continue to increase dramatically with each passing year.  The IMF and the U.S. FBI have estimated the 2022 impact of cybercrime around the world stood at an astounding 8.44 trillion USD.  As if that wasn’t bad enough, the outlook is for that amount to nearly triple by 2027, to 23.82 trillion USD.  The World Bank report for 2022 indicated a global GDP value of nearly 101 trillion US dollars.  With more than 8 trillion US dollars estimated to have been lost to cybercrime, this unfortunately has a dampening effect on global economic growth.  The losses of the world economy to cybercrime have the effect of lowering global GDP (1) value by several percent, according to Newton-Evans Research Company, which has been including cyber-security related questions in its industry surveys for nearly 30 years.  Newton-Evans has also served as a lead international survey partner for several CIGRE working groups for the past 15 years   Click on Figure 1 below for chart expansion of frequently used range estimates of dollar losses to cybercrime.
In 2018, the World Economic Forum’s (WEF)  Centre for Cybersecurity launched the Systems of Cyber Resilience: Electricity initiative. This groundbreaking effort helped bolster the cyber resilience of the global electricity infrastructure by bringing together leaders from over 60 businesses, governments, civil society, and academia. The objective was to develop a comprehensive cybersecurity vision to protect the power infrastructure.

During 2023, the WEF’s Centre for Cybersecurity and 11 founding members (2) comprised of electrical equipment manufacturers, systems integrators, cybersecurity firms and utilities launched a new iteration of the initiative known as Systems of Cyber Resilience: Electricity.  The objective of this new program is to establish “. . . an independent multi-stakeholder community that will continue to collaborate and take collective action.  The community will serve as a global exchange platform for cybersecurity leaders in the electric sector.”

The WEF initiative for the electricity sector has already resulted in the publication of three sector-relevant white papers.  These are:  Cyber Resilience in the Electricity Ecosystem: Principles and Guidance for Boards; Cyber Resilience in the Electricity Ecosystem: Playbook for Boards and Cybersecurity Officers; and Cyber Resilience in the Electricity Ecosystem: Securing the Value Chain.

In one estimate prepared by Accenture, the estimated combined foregone revenue losses shared among utilities and other energy companies over the five-year period 2019-2023 was forecasted to be more than $400 million USD.

Now for the role of telecommunications in the mix.  The ITU (International Telecommunications Union) is the UN agency charged with responsibility to “…maintain and extend international cooperation among all the Member States of the Union for the improvement and rational use of telecommunications of all kinds.”  The ITU promotes the shared global use of the radio spectrum, facilitates international cooperation in assigning satellite orbits, assists in developing and coordinating worldwide technical standards, and works to improve telecommunication infrastructure in the developing world.

A fundamental role of ITU, based on the guidance of the World Summit on the Information Society (WSIS) and the ITU Plenipotentiary Conference, is to build confidence and security in the use of Information and Communication Technologies (ICTs).  Back in 2007, the ITU launched the Global Cybersecurity Agenda (GCA), as a framework for international cooperation in this area.

Private Sector Reporting on Cybercrime:

McAfee and the Center for Strategic and International Studies (CSIS) released a well-researched 2018 white paper entitled “Economic Impact of Cybercrime – No Slowing Down.” (3)  This 23-page report is full of still-pertinent information on the pervasive effects of cybercrime.

The report identified some of the hidden costs from the aftereffects of cybercrime including loss of intellectual property and confidential business information; online fraud and financial crimes, financial manipulation, opportunity costs, and reputational damage.

The report recommended uniform implementation of basic security measures, including regular updates and patches, and open security architectures; discussed the need for increased international law enforcement cooperation; expressed improving or replacing existing processes such as the Mutual Legal Assistance Treaty, which allows one government to request the help of another in investigating cyber crime or obtaining evidence.

In late 2018, Deloitte, The UK-headquartered global professional services firm, published a white paper entitled “Managing Cyber Risk in the Electric Power Sector. “ (4)   The Deloitte report pertains to the global electric power community, though the chart referenced  in the article was developed from available US information.  In the figure provided in the article, one can note the relative importance placed on various threat actors and their business and operational impact from key types of cybercrime activities.

While criminal gangs are most likely to cause financial loss and theft of customer data, rogue nation-states are more likely to focus their efforts on destruction of infrastructure as well as theft of customer data.

In late 2020, McKinsey & Company also wrote about the threat of cybercrime against the energy industry and provided approaches to addressing vulnerabilities peculiar to energy infrastructure.  In the McKinsey article, the authors defined four levels of security zones for a power-generation plant, and discussed how utilities can set up a best-practice approach to cyber security. (5)

In 2022, Accenture published a paper on cybersecurity for utilities. (6)  In the paper, the company’s authors reported having observed three characteristics that make utilities especially vulnerable to cyber threats.

  • increased numbers of threats and actors targeting utilities: nation-state actors seeking to cause security and economic dislocation, cyber criminals who understand the economic value represented by this sector, and hacktivists out to publicly register their opposition to utilities’ projects or broad agendas.
  • The second vulnerability is utilities’ expansive and increasing attack surface, arising from their geographic and organizational complexity, including the decentralized nature of many organizations’ cybersecurity leadership.
  • The electric-power and gas sector’s unique interdependencies between physical and cyber infrastructure make companies vulnerable to exploitation, including billing fraud with wireless “smart meters,” the commandeering of operational-technology (OT) systems to stop multiple wind turbines, and even physical destruction.

This year, the U.S. Securities and Exchange Commission has enacted Code of Federal Regulations (CFR)  Rule #17, which stipulates that publicly traded companies must report cyber security incidents and must provide some information about their cyber security methods and procedures.  The ruling is mandated to come into effect mid-year 2024.  This ruling will affect all investor-owned electric, gas and water utilities as well as other publicly traded energy industry companies. Here is a section of the ruling:

The Securities and Exchange Commission (“Commission”) is adopting new rules to enhance and standardize disclosures regarding cybersecurity risk management, strategy,governance, and incidents by public companies that are subject to the reporting requirements of the Securities Exchange Act of 1934. Specifically, we are adopting amendments to require current disclosure about material cybersecurity incidents. We are also adopting rules requiring periodic disclosures about a registrant’s processes to assess, identify, and manage material cybersecurity risks, management’s role in assessing and managing material cybersecurity risks, and the board of directors’ oversight of cybersecurity risk.. (7)

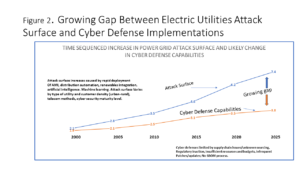
In summary, there is no shortage of good information available on measures that, taken together, may enable utilities and the energy industry in general, to form a more robust and increasingly resilient defense against pervasive cyber threats and cybercrime.  When I review where the industry stands today, and compare it to the millennial year, however, what appears to be worrisome is a perception that we are not yet always including cybersecurity and cyber defense at the top of the concerns when initiating new and further afield methods of grid and pipeline monitoring and control.  This gap can be significantly narrowed if we place cyber expertise, supply chain component knowledge and software bills of material on a strategic planning level within our utilities, other energy firms and commercial/industrial entities supporting the utility/other energy communities. The SEC ruling will mean advances in cyber reporting, but that still leaves similar reporting yet-to-be-required in such a manner among public utilities, cooperatives and privately-held energy companies.  Click on Figure 2 to expand for a view of Newton-Evans’ perception of the growing gap between energy industry attack vectors and cyber defense capabilities.  With strong efforts from both the public and private sectors around the world, this gap can be narrowed significantly in the coming years.
On October 23, 2023, Interpol released information about the take-down of a notorious cyber-criminal gang – Ragnar Locker Ransomware group, headquartered in Western Europe.  This criminal organization had targeted critical infrastructure over the years.  A detailed write-up can be found here:  https://www.europol.europa.eu/media-press/newsroom/news/ragnar-locker-ransomware-gang-taken-down-international-police-swoop.  Hopefully this will be but one of many take-downs of cyber criminal organizations in the months and years ahead.

During 2024, be on the lookout for CIGRE WG D.54’s (Regulatory Approaches to Enhance EPUs Cybersecurity Frameworks) scheduled publication of a technical brochure that includes findings from surveys of electric power utility (EPU) officials involved with cybersecurity from nearly 40 countries and another survey of national regulators and their roles in ensuring cyber security within their country’s borders and sharing with the international community.  This CIGRE working group has had the benefit of cooperation from delegates and survey participants located in North and South America, Western, Central and Eastern Europe, Africa and Asia.

End-notes:

  1. According to the World Bank, the global GDP reached 100.56 trillion US dollars in 2022. See https://data.worldbank.org/indicator/NY.GDP.MKTP.CD .
  2. The 11 founding members include Dragos, EDP, Enel, Hitachi Energy, Iberdrola, Naturgy, Ørsted, Schneider Electric, Siemens Energy, Southern Company and Vestas.
  3. https://csis-website-prod.s3.amazonaws.com/s3fs-public/publication/economic-impact-cybercrime.pdf
  4. See https://www2.deloitte.com/content/dam/insights/us/articles/4921_Managing-cyber-risk-Electric-energy/DI_Managing-cyber-risk.pdf .
  5. https://www.mckinsey.com/capabilities/risk-and-resilience/our-insights/the-energy-sector-threat-how-to-address-cybersecurity-vulnerabilities
  6. https://www.accenture.com/content/dam/accenture/final/a-com-migration/pdf/pdf-177/accenture-cybersecurtiy-for-connected-energy-ecosystems.pdf#zoom=40
  7. https://www.sec.gov/files/rules/final/2023/33-11216.pdf


Posted on

Tremendous Growth in Deployments of Battery Energy Storage Systems (BESS)

Introduction:

The Department of Energy’s primary energy statistics provision unit is the Energy Information Administration, originally chartered to provide unbiased information on energy production and usage for the U.S. Congress.  The separate EIA website further states The U.S. Energy Information Administration (EIA) collects, analyzes, and disseminates independent and impartial energy information to promote sound policy decision-making.  Overall, the DOE employed 15,124 people as of July, 2022.  Of this total, only about 350-400 personnel work within the Energy Information Administration, according to a recent Congressional Research Service report prepared for Congress.

Article Focus:

This article focuses on the rapidly developing market for large-scale bulk energy storage systems in the United States.  Much of the source information for this article has been provided by the DOE’s Energy Information Administration (EIA). The EIA early release of Form EIA-860, Annual Electric Generator Report, issued in July, 2023, is found here: https://www.eia.gov/analysis/studies/electricity/batterystorage/  .

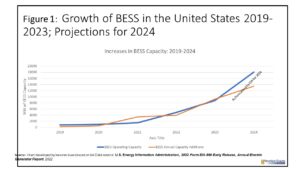
Note in the accompanying chart (Figure 1) the tremendous growth spurt in total MW of BESS capacity over the 2019-2022 years, extending out to the projected new installations now planned for 2023 and 2024.  By year-end 2022, nearly nine GW of BESS capacity had been installed in the U.S.  Note:  Click on each chart to enlarge:

Importantly, BESS usage can be viewed on multiple levels and from various angles.  For example, units can be seen by age of the installation, by location of the units, by installed cost based on duration of capacity, by ownership type, whether the BESS units are stand-alone or are co-located with power generation facilities (fossil and renewables), and from a ranking of applications served by the BESS unit.

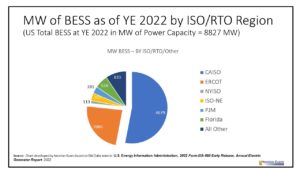
The second chart shown here (Figure 2) portrays the ISO/RTO regional locations of BESS by MW of installed capacity.  Note the high proportion of currently installed BESS power capacity that is found within CAISO (53% of the nation’s total at YE 2022), and ERCOT (with about 23% of the nation’s total).  The remaining nearly one quarter of installed BESS capacity is shared among five regions (NYISO, ISO-NE, PJM, Florida and “all other areas”).

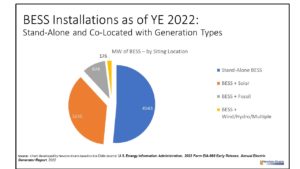
The next chart (Figure 3) illustrates the dominant role of “stand-alone” BESS installations.  BESS plus solar sited installations are also significant, amounting to 3,235 MW of capacity. BESS co-located with fossil generation facilities is relatively important, providing 874 MW of capacity. The one surprising observation (to the author) is the relative scarcity of BESS installations co-located with wind farms, hydro and other generating facilities.

As mentioned earlier in this article, there are myriad additional ways to look at BESS installations.  In terms of applications used as the basis for installing BESS units, Frequency Regulation was the response having the most MW of capacity (6685), Arbitrage was second (5214 MW), followed by Spinning Reserve or Ramping (4935 MW) and Excess Generation storage (2963 MW).  Lower down in BESS installation application rankings  included voltage or reactive power support, load management, system peak shaving and load following.

Another approach to segment assessment involves a look at ownership types.   IPPs (Independent Power Producers) are responsible for a majority of installed BESS MW of capacity (7232 MW),  Electric utilities account for about 1463 MW of installed capacity and C&I firms for most of the remaining installed capacity.

As things look right now, and if supply chains can improve so that the necessary components of battery energy storage systems can continue to be manufactured, assembled and installed to meet market demand levels, the BESS market is destined to continue growing at high double digit levels through much of the remaining 2020’s.  By YE 2024 it appears to us that the equivalent of more than 30 GW of BESS power capacity will be installed and operational throughout the United States.

Posted on

Substation Automation and Integration Services – Guiding the Way to the Digital Substation

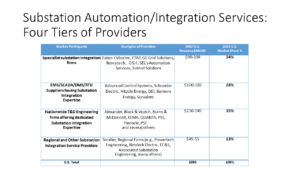
Substation Automation Integration Specialists are firms (or business units of large electrical equipment manufacturers) that can assist with or develop and provide a full or partially automated electric power substation on a turnkey basis, leading to “digital substations.” These companies help utilities and C&I firms toward digital substations.  Such firms include dedicated businesses (see examples below) or can be business units of larger companies engaged in the electric power automation business as EMS/SCADA suppliers, RTU/PLC/PAC/gateway manufacturers or protection and control specialists.  As well, T&D engineering firms, from the nation’s TOP 10 in size and reach, to dozens of smaller but capable regional service businesses are involved in helping utilities and C&I firms integrate and automate (or digitize) the nation’s nearly 70,000 utility T&D substations and another several thousand substations that are managed and operated directly by C&I firms, including large renewables installations.


Four “tiers” of substation integration providers are included in our assessment:

  • Specialist substation automation integration service revenues in 2022.es
  • SCADA industry participants with substation devices (RTUs, FEPs, Relays, IEDs, platforms) offering substation integration expertise
  • National T&D Engineering Services firms with substation integration expertise
  • Regional T&D Engineering Service firms

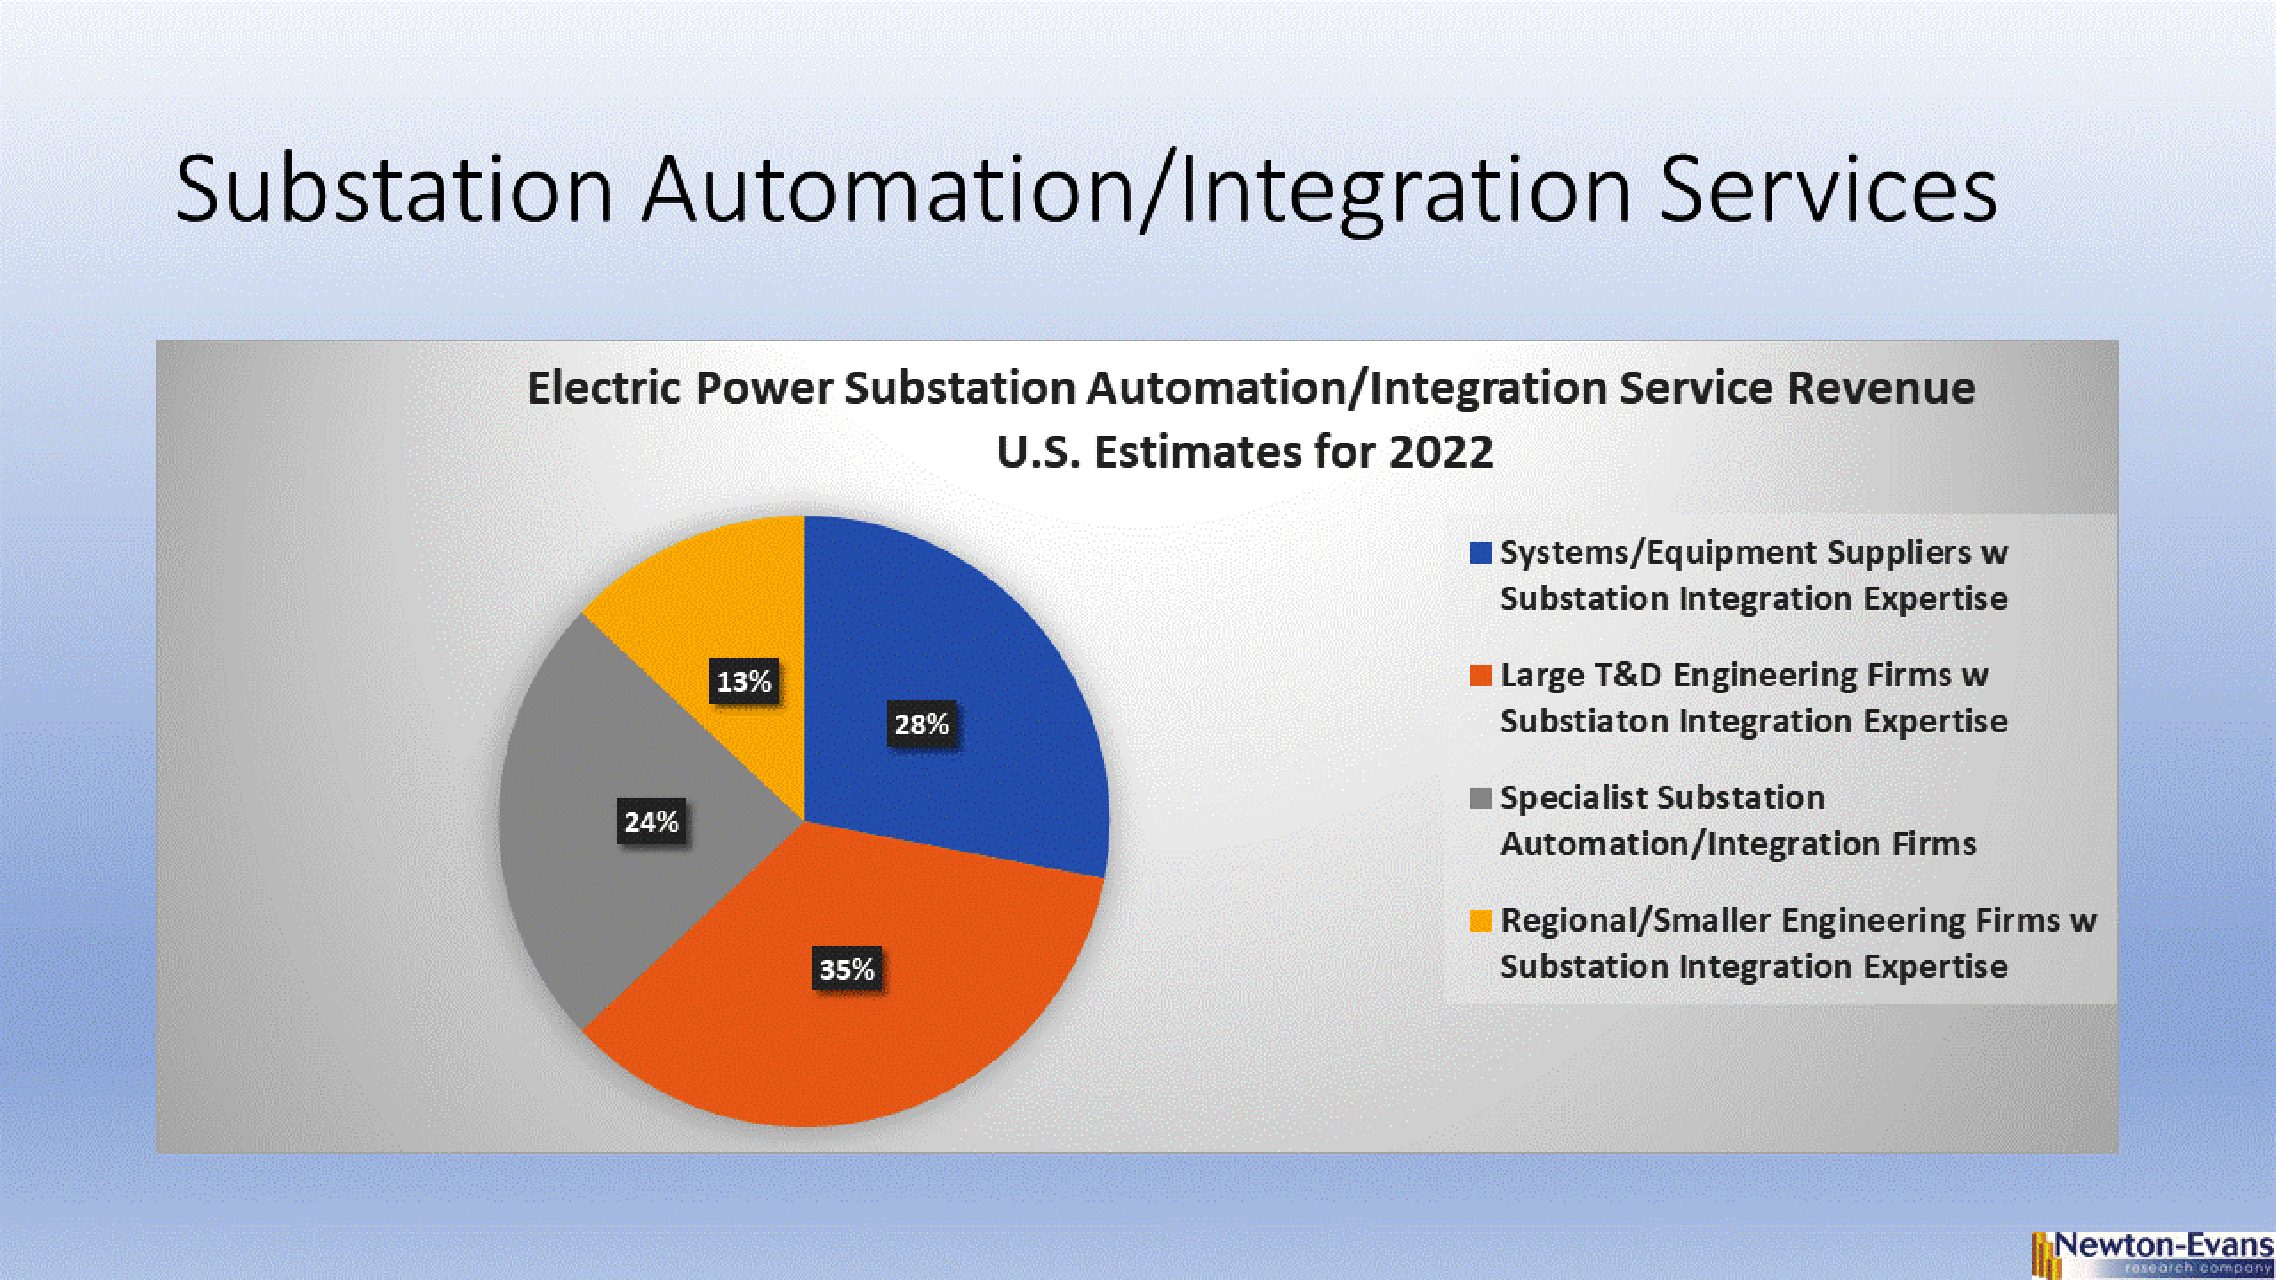
Together, these automation and integration services providers accounted for nearly $400 million of substation automation and integrations services-related revenue in 2022 (Newton-Evans estimate).  Click on chart to expand view.

Turnkey costs for substation integration services range from an estimated $45-55,000 for a small distribution substation having few feeders to upwards of $250,000 for a large transmission substation. Some metro-area MV substations with 20 or more feeders can cost upwards of $300,000 to automate and provide device integration services.

The automation equipment/device costs are in the range of $50,000-250,000 for a distribution substation and can range up to $500,000 for smart equipment and integration services in EHV transmission substations.

These totals shown in the chart below for automation and integration services are but a portion of the total expenditures allocated to electric power substations.  New substation construction (greenfield) and up-rating activities (brownfield) account for a few billion dollars, while substation equipment and communications costs also account for several billion additional dollars.

Posted on

Wind Turbine Controls Usage Patterns Study Underway

During April and early May, Newton-Evans Research is conducting studies on the American wind power market.  Of specific interest is the  wind turbine controls segment of the fast-growing renewables business.

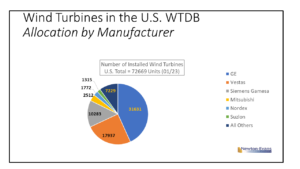
We are researching the types and brands of control devices and control systems that are in use among the more than 72,000 wind turbines installed in the United States as of January 2023.¹

Importantly, most controls within the wind turbine itself are provided by the OEM – the wind turbine manufacturer.  In the U.S., that likely means one of six manufacturers that account for 90% of all utility-scale wind turbine installations as of January 2023.  Three of the six (GE, Vestas, Siemens Gamesa) accounted for a whopping 82% of wind turbine installations.  Three others (Mitsubishi, Nordex and Suzlon) account for nearly 6,000 operational wind turbines operating throughout the country.  In addition to the major OEMs, there are more than 10 other manufacturers having at least 50 or more operational U.S. wind turbine installations.  See Figure 1. (Click on the figure to expand the view).

When it comes to wind turbine controls, multi-site wind farm operators and owners have more say in determining control devices and control systems selections as needed, especially for controls that reside external to the wind turbine.   Larger wind farms configured with wind turbines from multiple manufacturers also tend to have more interest in procuring PLCs, SCADA systems and plant-wide and multi-plant control and monitoring systems.  Wind farm operators and owners also tend to make more of the turbine control selections when it comes to retrofitting wind turbines.

There are more than a dozen wind controls specialist firms actively marketing and installing pitch and yaw controls, and/or condition monitoring systems in the United States.  Many wind turbine control specialists active in the U.S. are headquartered in European countries having extensive wind power installations and decades of wind power experience, led by firms based in Denmark, with others in Spain, Germany, Austria and Italy.  Some companies provide their own fine-tuned PLCs and wind-specific SCADA systems (you can read our 2021 article on renewables SCADA here): https://www.newton-evans.com/scada-systems-for-the-renewables-energy-industry-and-adms-for-utilities/.

We are still seeking a few additional participants to two short surveys.  One survey is geared to wind farm operators/owners, and can be answered by experienced wind turbine technicians.  The second survey addresses the OEM and wind turbine controls supplier community.  If you qualify to participate, please contact Chuck Newton (cnewton@newton-evans.com) and a link to the appropriate survey will be forwarded. 

Note:  1. Wind turbine installation data is provided by the U.S. Geological Service:  https://eerscmap.usgs.gov/uswtdb/

Posted on

Voltage Regulators –Guardians for Maintaining High Quality Power Distribution


Voltage Regulators –Guardians for High Quality Power Distribution  –   In an electric power distribution system, voltage regulators may be installed at a substation (1p/3p) or along distribution lines/feeders (1p) so that all customers receive steady voltage independent of how much power is drawn from the line. The distribution automation portion of the VR market is primarily for automated control of single-phase units installed along MV distribution lines.  In both distribution feeder and substation applications, VRs are often paired with power capacitors.

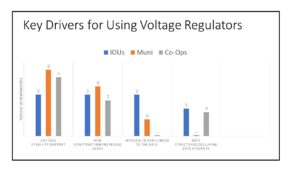
Currently the single most important factor behind the growth in use of single-phase VRs is the increase in installations of distributed energy resources (DERs) and the impact that these grid-connected resources are having on grid voltage stability.  Because of the variable or intermittent nature of DERs, there is a need to control voltage fluctuations, hence the push to utilize more VRs by utilities that are actively involved with DERs in their service territories. New construction of C&I sites, residential developments in the suburbs as well as feeder length in large rural areas are also key factors affecting the increase in use of VRs.  Certain regulatory actions in place or planned will continue to influence the need for VRs.  See the chart just below for a look at key drivers for using VRs among IOUs, Public Utilities and electric power cooperatives.

Click on chart to enlarge! Keep in mind that the nation’s electric power delivery/distribution system was designed for one-way (or uni-directional) power flow, and with the development of DERs, we are confronted with a need to accommodate two-way (bi-directional) power flows.  This changes the feeder voltage profile making voltage regulation more challenging, with DERs tending to cause local voltage rise along a distribution feeder.  The expansion of variable renewable generation resources owned by industrial/commercial companies will mean growth in the non-utility/C&I portion of the VR market.  VRs will continue to be used to control voltage levels from these intermittent resources.

 Market Size Summary:

Some suppliers have suggested to Newton-Evans that growth of 10-15% per year is on the horizon.  A lot will depend upon continuing economic recovery and the promulgation of DER-friendly policies and regulations being planned over the coming years.  Currently, there are three principal manufacturers of automated voltage regulators serving the domestic U.S. market.  These are General Electric, Eaton Corporation and Siemens.  Together the “Big Three” control about 75-80% of the combined VR market.  Howard Industries is next, followed by Schneider Electric, Delta Star and Basler Electric with each having a few dozen important utility customers and together comprise the remaining 20-25% of the VR equipment manufacturing market.

Market Drivers:

Currently the single most important market driver for using VRs is the increasingly important role of distributed energy resources (DERs) and the impact that these resources are having on grid voltage stability.  Because of the variable nature of DERs, there is a need to control voltage fluctuations, hence the push to utilize more VRs by utilities that are actively involved with DER in their service territories. New construction of C&I sites and residential developments in the suburbs are also key factors affecting the growth in use of VRs.  Feeder length among suburban, exurban and rural areas and some regulatory actions also impact the need for VRs.  Perhaps offsetting some of the demand from DER sites will be a new generation of smart inverters that may be able to provide voltage stability from DER sites to the grid interconnection point, perhaps nullifying the need for a separate VR on-site.  The publication of IEEE 1547-2018 provides for performance criteria for DERs including such functionality as Volt-Var control which can also be used to help regulate the distribution system.

Operational Driver:

While the use of single-phase VRs can be found among many hundreds of IOUs, public utilities and cooperatives, the use of three phase VRs is less widely used among munis and co-ops.  Many of these utilities have switched to using single-phase units where, in the past, they may have used a three-phase unit.  There are also about 10-15% of utilities that do not use VRs, but rely on on-load tap changers (OLTCs) with substation transformers – most within urban corridors with relatively short distribution feeders.  You may want to return here for more articles on grid modernization over the coming weeks and months.

Posted on

Distribution Line Sensing: Approaches to Monitoring Distribution Feeders for Power Quality and Improving Reliability Indices

Newton-Evans Research has developed the following info-graphic illustrating what the company believes to be a T&D market segment wherein growth is currently outpacing some other “smart grid” related developments.  This is the distribution line sensing equipment/device (or DLS) market.  For this article I have combined two related sub-segments of the DLS market – distribution fault indicators and line-mounted monitoring devices. With more than a quarter million primary distribution feeders in operation in the U.S. there is a growing requirement to monitor feeder performance, as is now being done on several thousands of the most critical distribution feeders in operation throughout the U.S. and Canada.  Implementations of DLS systems are being undertaken to shore up grid reliability, provide resilience and help minimize outage frequency and outage duration.

Two excellent baseline studies completed by the DOE’s PNNL a few years ago have helped with understanding related power distribution grid trends in the U.S. (1)   These reports, along with periodic DOE grid modernization reports to Congress, have provided the impetus for Newton-Evans to continue researching grid modernization, taking into account some of the ground-breaking activities being undertaken by many of the nearly 3000 U.S. and Canadian distribution utilities. Newton-Evans will soon be conducting the third in a series of short-length, repetitive surveys conducted over multiple years.

    • Distribution Fault Indicators  are devices which indicate the passage of fault current. When properly applied, they can reduce operating costs and reduce service interruptions by identifying the section of  feeder that has failed. At the same time, fault indicators can increase safety and reduce equipment damage by reducing the need for sometimes hazardous fault-chasing procedures.  The bulk of installed basic fault indicators are stand-alone devices that provide visual alerts at fault locations along the feeder.
    • Line Mounted and line post mounted MV/DA monitoring devices perform online monitoring of voltage and/or current and/or loads, but do not provide controlling functions. Power sources may include power lines themselves using CT/PT technology, batteries, or even small solar panels. Modern line monitoring devices are typically part of a tri-partite system comprised of the line-mounted sensors, a communications modem and PC-based (or SCADA-based) analytical software. This allows for local or remote monitoring of the device. Some devices are designed with lighted indicators for onsite/local line problem status notification, as are the DFIs so designed.
    • On average, the typical respondent utility in our first DLS study (a commissioned research program) had about a third of a million customers. Overall, the participants in that study accounted for about a 12% sample of the quarter million (3) MV feeders then in operation across North America. A second study was conducted informally during 2020-2021 with a smaller sample of utilities.
    • Almost all of the survey participant utilities in both Newton-Evans’ studies were using some form of basic line sensor/fault current indicator technology on at least some of their operating feeders. Several utilities were using smart sensors by 2019 and a few were using the then-newest generation of advanced multi-attribute line sensors by 2021.
    • The top attributes being measured or monitored among a large group of listed attributes included fault detection, current monitoring, fault magnitude, voltage measurement and time stamping of events. In the more recent (2020-2021) informal follow-on to the 2019 study, these attributes remained as key benefits of smart and intelligent line sensor program adoption.
    • On the topic of data/status communications for smart or advanced line sensors, a significant percentage of respondents (about one-third across two surveys) reported that their line sensor installed base was using built-in communications with about one quarter of installed devices reporting to line-mounted communications modules – using a mesh networking approach.
    • Distribution line sensors by 2021 were most often reporting to SCADA systems (as indicated by about one half of respondents) while about one in five officials cited communications links to the utility’s outage management system (OMS).
    • Line sensor placement by 2021 was being determined by:
          1. evaluating feeder performance and starting with the instrumentation of weaker performing feeders and “critical” customer feeders.
          2. Analyzing customer density and load characteristics on the feeder. Typically, the higher the customer density coupled with the criticality of the feeder, coupled with larger load-carrying feeders were prime candidates for line monitoring installations.
          3. Locating sensors strategically- near switching points, along with feeders routing power to hospitals, police, fire, military installations, government facilities.
    • Importantly, line sense device/system decision-making criteria to both earlier groups of surveyed utilities centered around four attributes: “reliability and long service life”, “ease of installation”, “battery-free operation” and “price.”  It will be interesting to see how these compare this summer with a 24-month interval between studies.
    • In addition to distribution line sensors and line-mounted monitoring devices, there are ancillary market segments that utilize the same, or similar, sensing and communications technology as found in transmission lines, underground lines and T&D capital assets, including substations and field equipment.

Newton-Evans will be re-surveying participants from the earlier distribution line monitoring studies, as well as including additional utilities in a planned mid-2023 update to these earlier research efforts.  Interested parties can contact Newton-Evans for further information regarding participation as sponsors or as survey participants.

__________________

Sources: 

  1. U.S. Department of Energy, Pacific Northwest National Laboratory, Electric Distribution Systems – Volume 3 (July 2016) and Modern Distribution Grid – Three Volume Study (2017)
  2. “Smaller” utilities involved in the Newton-Evans studies included those having at least 30,000 customers. Note that there are also more than 1,500 North American electric power distribution utilities with each having fewer than 30,000 customers.
  3. As estimated by Newton-Evans, based partly on the PNNL studies cited in footnote 1 above and as accounted for in Newton-Evans own files of counts of primary feeders.
Posted on

Reviewing Market Studies from the COVID years now passed. . . and a brighter look ahead . . . a Janus view!

During the past 36-month period, Newton-Evans Research studied a few topics that we had not researched in prior years.  These topics included data diodes, synchronous condensers, battery energy storage systems and network transformers. During the months leading up to the Covid era of 2020-2021, we also completed studies of distribution line sensors and uncovered trends in application of voltage regulation devices.  During 2020, we looked in-depth at electric vehicle adoption rates and prepared a mid-range outlook for grid modernization programs.  Here are some of the more interesting and perhaps relevant insights gathered from some of these research assignments.

Data Diodes:

Data diodes have been around for decades.  These devices are most often used by the military and by critical infrastructure organizations around the world.  Data diodes and unidirectional gateways are network appliances that allow data to travel in only one direction.   Typically, these devices are used as connections between two or more systems of differing security classifications, such as operational control systems transmission of data files to IT systems.

The product life cycle for these devices in the U.S. energy industry is still in its embryonic stage in some segments (T&D, renewables); while in other energy segments (TOP 25 energy companies) the product life cycle is clearly in the growth phase, and in a few segments (nuclear plants, large oil refineries) data diodes are nearing the maturity stage.

Energy industry spending in the United States on data diodes/unidirectional gateway systems now exceeds $25 million annually.  The majority of equipment sales have been limited to the largest oil and gas companies, large power generation facilities, nuclear plants, and to some larger electric power transmission and distribution utilities.  Our own limited surveying in 2022 indicates additional evaluations are now underway for data diode – unidirectional gateway use in more T&D applications and among a broader array of utility types and sizes.

Battery Energy Storage Systems – BESS.

The battery energy storage systems (BESS) market in the United States has grown exponentially over the past decade.  The Energy Information Agency (EIA) within the Department of Energy has maintained a repository of information on energy storage trends in the United States.   The total energy storage capacity for electricity exceeded 1000 MW and about 1700 MWh by 2020, according to the EIA.  Published commercial sources report that the growth trends for BESS continued during the COVID pandemic and further reported that battery energy storage capacity is larger than the numbers last reported by EIA.   For one example, IHS-Markit reported recently that battery energy storage amounted to nearly 2000 MW in 2019, and had grown to 4,000 MW by 2021.

Battery R&D Today in the United States . . . Key to independence and assured supply in coming years!

  • Very active level of battery R&D underway
  • Battery R&D start-ups funded largely by private investment firms.

Services Provided by Battery Manufacturers

  • Major Li-Ion battery manufacturers are becoming (or planning to become) full-service partners with utilities – providing integration and maintenance services, thereby attempting to cut out the “middleman” integrators currently involved in BESS Engineering, Procurement and Construction/Integration, thereby shortening the supply chain.
  • Utilities are currently using one, two or all three of these sources for BESS integration: battery manufacturers, BESS integration specialist firms, or their own engineering staffs.
  • The Newton-Evans’ commissioned survey conducted as part of the study found a number of commercial BESS integration services being used by large electric utilities.

Synchronous Condensers:

There are four drivers that affect the U.S. market (in terms of annual opportunities and units of syncon equipment) for synchronous condensers (or syncons) that exists today.  These drivers include  early shutdowns of fossil power plants; loss (or erosion of) of spinning reserves;  increased use of distributed energy resources and its impact on grid stability; and, the lack of grid-forming devices.

What we have heard is that utility/plant engineering staffs are looking for reliable, cost-effective approaches to deal with the threats to grid stability in some utilities and in some regions of the country caused by the above-listed drivers.

“About 15% of the US fossil fuel power fleet shuttered between 2009 and 2018. But most of these plants are built to last 30 to 50 years, long enough to pay off the hundreds of millions of dollars it takes to build them. To meet (President) Biden’s 2035 goal, many plants will inevitably have to be switched off before the end of their natural lifespan.” (Source:  Yahoo Finance).  There are a total of about 10,400 fossil-powered generators in the U.S. and about 3,500 utility-operated or commercially-operated fossil plants (source: EIA).

U.S. coal power capacity peaked over 317,600 MW in 2011, according to EIA data. It has declined every year since and was down to about 216,800 MW by the end of 2020.  By year-end 2022, the figure yet to be reported by EIA, coal power capacity will likely be less than 200,000 MW.

We found that even though synchronous condenser equipment has been available for more than a century, and implementations have been quite  successful in providing grid stability, voltage support and short circuit capacity and in offsetting the lack of grid-forming devices, there are other FACTS-based approaches to meeting similar grid operational requirements.

Nonetheless, there is a resurgence of interest in syncon technology and a wave of recent utility reviews are ongoing for both very large MVAR capacity units, as well as for syncon units that could be installed at key medium voltage substations and at DER interconnection points along the grid. The overall U.S. market for syncon equipment may well reach the quarter billion dollar level by 2024, in our opinion.

Network Transformers:  Industry’s Response to Densely Populated Inner-City Areas

Network transformers are vault or subway type units of equipment and are not pole, pad or substation units. The specifications for vault and subway are very similar with substation units having better corrosion specifications. NWTX units are designed for mounting in underground rooms and are common in dense city locations where surface mounted transformers would be a visual and traffic obstacle.

Network Transformers (NWTX) typically range from 300 kVA to 2,500 kVA three-phase. The Primary voltage ranges from 2400 VAC to 34,500 VAC and the secondary from 600VAC to 208 VAC. The type may be oil, dry or cast coil. The primary is usually delta connected, and the secondary is wye connected. The high-voltage connection is usually to a network switch or an interrupter-type switch. The secondary connection is usually to a network protector or a low-voltage air circuit breaker.

Downstream protection equipment is almost always provided separately and not bundled into the NTWX sale. All come with a basic DNP3 interface, but no suppliers currently add any type of asset management software. Standards for NWTX are C.57.12.24-2016 and C.57.12.40-2017.  All suppliers to the North American market meet these standards for NWTX units. Some older rebuild units, however, may not meet these standards.

Liquid filled NWTX systems traditionally came with mineral oil fill but FR3 10C is now the most popular fill. The 2016 DOE energy standard did require all suppliers to upgrade their NWTX products.  Virtually all NWTX transformers are built to order and virtually none are stocked ready to ship. There appear to be too many variables in the voltages, material of construction, gauges, piping, etc. to justify stocking a ready supply of NWTX units.   The manufacturing process may take about 6 weeks from receipt of order. None of the suppliers we interviewed see much change in the regulations over the mid-term, since the adoption of the  DOE 2016 specification, so product designs should remain stable going forward for the next few years.

Perhaps the most important regulatory driver affecting the future of network transformers is the increasing need among critical infrastructure facilities (hospitals, commercial centers, military installations, certain micro-grids) requiring reliable, resilient electric power.  Secondary and spot networks comprised of network transformers and network protectors can help urban utilities meet these requirements.

Network transformers have been playing a critical role in keeping the lights on in major urban centers for decades.  NWTX installations have been highly reliable as silent “partners” in the provision of power critical to commerce, industry and government offices.  Secondary and spot networks have proven their worth as they have continued to work in a near “fail-safe” environment.  This is often seen in power outages occurring in the same metropolitan area not being served by such distribution network configurations.

The combined network transformer market in the US and Canada likely reached/crossed the $100 Million level  in 2021. The bulk of the market (85-90%) is usually comprised of sales of 3p units.  This estimated market size  seems realistic in light of the annual unit replacement rate (based on a 35-year life expectancy) and moderate levels of net new shipments. We had excellent support from ARC Advisory, which firm partnered with us in undertaking this baseline study.

Next month, our posting will include excerpts from recent studies of distribution line sensors, trends in application of voltage regulation devices, electric vehicle adoption trends and a mid-range outlook for grid modernization programs

 – Chuck Newton


Posted on

Newton-Evans Research Company’s U.S. Market Overview Series Continues with Nine New Protection and Control Summaries

In the new 2022-2024 Protective Relay series, the authors have assessed the market estimates made by Newton-Evans in other recent reports, both multi-client and commissioned.  In this series we have made specific range estimates for four of the most widely used protective relays, including motor control relays, distribution feeder relays, line differential relays and generator relays.  We have grouped a number of substation relays together as one entity covering relays for busbar, transformers, capacitor bank, switchgear, breaker failure, and other types of transmission line protection relays.

In the recent mid-2022 series of market overviews covering substation automation topics, we estimated the total of digital protective relays shipped to U.S. utility and C&I customers in 2021 to have a value of more than $800 million. When the groupings reported here are summed, the total values of 2021 product shipments concur with the totals for digital relays as reported in the earlier substation automation series. The vast majority of protective relays used by utilities are digital, while solid state units are more frequently used in telecom and motor-related applications and in one-for-one replacement of some electro-mechanical relays.

In addition to digital protective relays, closely related report topics are evaluated in this new series.  Included are individual report summaries on electro-mechanical relays, synchrophasors, drop-in substation control houses, and teleprotection equipment.  In total, Newton-Evans estimates the value of 2021 factory shipments of products covered in this series totals more than $1.1 billion.

Commercial and industrial customers account for about one-third of our total estimate of spending across the nine topics covered in the series.  This significant percentage is primarily due to the large volume of motor protective relays shipments, with the majority of these shipments made to C&I customers rather than to electric utilities.  As more and more distributed energy resources come online with ownership primarily by non-utility entities, there will be more purchase of protection-related products, equipment and services made by C&I customers.  During the 2022-2030 years, Newton-Evans anticipates significantly higher levels of C&I procurements necessitated by the construction of non-utility owned substations, requiring outlays for a variety of protective relays, drop-in control houses and teleprotection equipment.  Interested readers can view the product offering here: https://www.newton-evans.com/product/overview-of-the-2022-2024-u-s-transmission-and-distribution-equipment-market-protective-relay-series/.   See the following chart containing two overviews of our findings.

Posted on

Estimated Value of Selected OT/IT Systems Shipments and License Fees by U.S. Electric Utilities Now Exceeds $3 billion.

The 2022-2024 edition of the Newton-Evans’ U.S. market overview series covering developments in 12 control and monitoring systems and related IT/OT applications topics is now available for ordering on the company’s website.

The series covers the following topics with individual 2-to-4-page report summaries.  The summaries are based on our studies with utilities and industry discussions held over the past three years.  The market segments covered in this year’s series include energy management systems (EMS), supervisory control and data acquisition (SCADA), geographic information systems (GIS), customer information systems (CIS), outage management systems (OMS), meter data management systems (MDMS), mobile workforce management systems (MWM), advanced distribution management systems and advanced distribution automation (ADMS/ADA), energy market management systems (EMMS), Cyber Security, generation management and distributed control systems (GMS/DCS) and distributed energy resources management systems (DERMS).

The total value of shipments/sales of these 12 systems and application software categories delivered primarily to U.S.-based electric utilities and C&I customers, is now estimated to be more than $3 billion annually.  Some major systems providers are active in a majority of these market segments, with industry segment specialists also key participants.

The C&I segment accounts for about $120-$150 million in procurements of these systems, as developed primarily for electric utilities.1   However, EMMS offerings are primarily oriented to ISO/RTO community, and DERMS solutions are regularly purchased by renewables aggregators, as are specialized SCADA offerings for wind and solar applications.

Some of the segments are oligopolistic, in that only a handful of suppliers are actively serving that particular market.  EMS and EMMS are two such examples.  Other segments are characterized by fragmented market shares held by many suppliers, as evidenced in cyber security, OMS and MDMS market segments.

Individual reports are priced at $195.00 and the entire 12-report series is available for $1,450.00.  Each market overview report includes a segment description, estimated market size, market shares for key participants and a market outlook through 2024.

  1. C&I firms spend additional billions of dollars on vertical industry-developed OT and IT systems such as factory-based SCADA and related automation systems and software.  Distributed control systems with appropriate industry-specific applications and functions is another prime example.  Today’s cyber security investments are also targeted in part to vertical market requirements, as are mobile workforce management systems.  CIS/CRM systems are also widely deployed in several segments within the C&I marketplace.
Posted on

GE-PROLEC + SPX Transformer Solutions (Waukesha) – A Rising Global Powerhouse for Power Transformers

With the early October 2021 completion of the GE-PROLEC acquisition of SPX Transformer Solutions, the transformer manufacturing industry is again itself transformed a bit.  With this acquisition the combined GE-PROLEC venture now takes on a  co-leadership position in the “low power, middle range and higher range segments” of the U.S. power transformer market.

SPX Transformer Solutions has been the U.S. market segment leader in the manufacture and sales of small power, medium power and large power transformers.  GE-PROLEC was already a third-place contender in the U.S. market for medium power transformers, shunt reactors and phase shifting transformers.  Historically, GE has been a dominant supplier of network transformers as well, and remains a segment co-leader.  Neither GE-PROLEC nor SPX Transformer Solutions has been a market leader in the provision of mobile transformers/substations, but other than that particular segment, the combined unit shipments and dollar values likely provides GE-PROLEC a market leading share of at least five segments of the power transformer business.  While GE-PROLEC is a “top five” participant in each of the three major categories of distribution transformers (overhead liquid units, dry transformers and pad mount units), the acquisition of SPX Transformer Solutions has no effect on their standing for distribution transformers.

Transformer Monitoring and Diagnostics:

GE historically has offered a wide range of solutions to monitor and manage critical assets on the electrical grid, detect and diagnose issues and provide expert information and services to customers. GE’s asset monitoring and diagnostics portfolio includes solutions for single- and multi-gas transformer DGA, enhanced transformer solutions and switchgear monitoring, as well as software and services.  GE was early into the transformer DGA monitoring business with its 1999 acquisition of the Montreal-based Syprotec organization.  The company’s efforts in transformer monitoring developments since then have made it a global leader in transformer health monitoring and diagnostics.

Waukesha’s transformer service business has been a mainstay for SPX in years during which equipment sales were flat or down, with the company’s service capabilities and offerings extended to provide service for non-Waukesha power transformers.

Revenue Estimates:

Newton-Evans estimates global revenues for the combined transformer equipment and services operations of the GE-PROLEC plus Waukesha (SPX Transformer Solutions) will exceed $1.5 Billion in 2021.  In the U.S. market, our 2020 estimate for GE transformer equipment sales in the U.S. market stands at $500-$550 million, and for Waukesha transformers our 2020 estimate of U.S. shipments is $300-$350 million out of a reported total of $427 Million in power transformer sales.

Combined GE-PROLEC and Waukesha transformer-related services and M&D device sales revenues in the U.S. are likely to reach $200 Million or more, with multiple regional service facilities operated by the combined business units.

Some History on GE’s Rise in the Power Transformer World Market

Back in 2014, during the time of GE’s acquisition of Alstom Grid, the latter firm was number three in the world in terms of large power transformer market share and assets, operating 13 plants with an annual production capacity of more than 130 MVA. GE Prolec was already a major North American market force with about a 14% share of the U.S. market.

At that same time in 2014, I had written the following: “Together, this alliance may become number three in the global market for large power transformers behind ABB and Siemens. To do so, the GE-Alstom combine will have to fend off HICO, Hyundai, Toshiba and MEPPI as well as three up-and-coming Chinese manufacturers.”  With additional non-organic revenue additions of nearly $500 Million achievable this year with combined reporting from Waukesha, GE-Prolec will indeed firm up its position as the third leading supplier of power transformers – no longer far behind Siemens Energy and Hitachi-ABB Power Grids.

 Sources: 

(1) Newton-Evans Research Company’s 2021-2023 edition of Market Overview Reports:  Transformer Series-Complete Set

(2) 2020 Annual Report for SPX Corporation.

(3) 2020 Annual Report for General Electric Corporation.