
The 2024-2026 edition of Market Overview for Substation Automation includes 14 topical reports on modern substation components. This month’s article presents some highlights from 7 of these reports. In June, we will provide another seven summaries of modern substation components.
More information on the 14-report series of substation automation components can be found here: https://www.newton-evans.com/product/overview-of-the-2024-2026-u-s-transmission-and-distribution-equipment-market-substation-automation-series/. The complete 2024-2026 series is priced at $1,450.00, with individual 3-5 page report summaries available for $195 per report. Each report provides component definitions, revenue estimates of key suppliers, market share assessments, outlook through 2026, and revenue split between sales to utilities and commercial-industrial buyers.
Remote Terminal Units: A Remote Terminal Unit is a microprocessor-controlled electronic device that interfaces objects in the physical world to a distributed control system or to SCADA by transmitting telemetry data to the system from substation-based RTUs and pole-top- installations, and by using messages from the supervisory system to control connected objects. RTUs are evolving into substation gateways, controllers and servers, depending upon the manufacturer and the application/intended use. See the separate report on substation automation platforms – (SA01 in this series).
Programmable Logic Controllers (PLCs) are microprocessor-based devices used to control industrial processes or machines. They provide advanced functions, including analog monitoring, control and high-speed motion control as well as share data over communication networks. During the 1980s and 1990s, hundreds of units were sold annually for use in electric power substations, led by Schneider’s Modicon and Allen-Bradley. Programs to control machine operation are typically stored in battery-backed or non-volatile memory. A PLC is an example of a hardened real time system since output results must be produced in response to input conditions within a bounded time, otherwise unintended operation will likely result.
PLCs are designed for multiple inputs and output arrangements, extended temperature ranges, immunity to electrical noise, and resistance to vibration and impact. Programs to control machine operation are typically stored in battery-backed or non-volatile memory. A PLC is an example of a hardened real-time system since output results must be produced in response to input conditions within a bounded time-frame, otherwise unintended equipment operation will/may result. SA02 in this series.
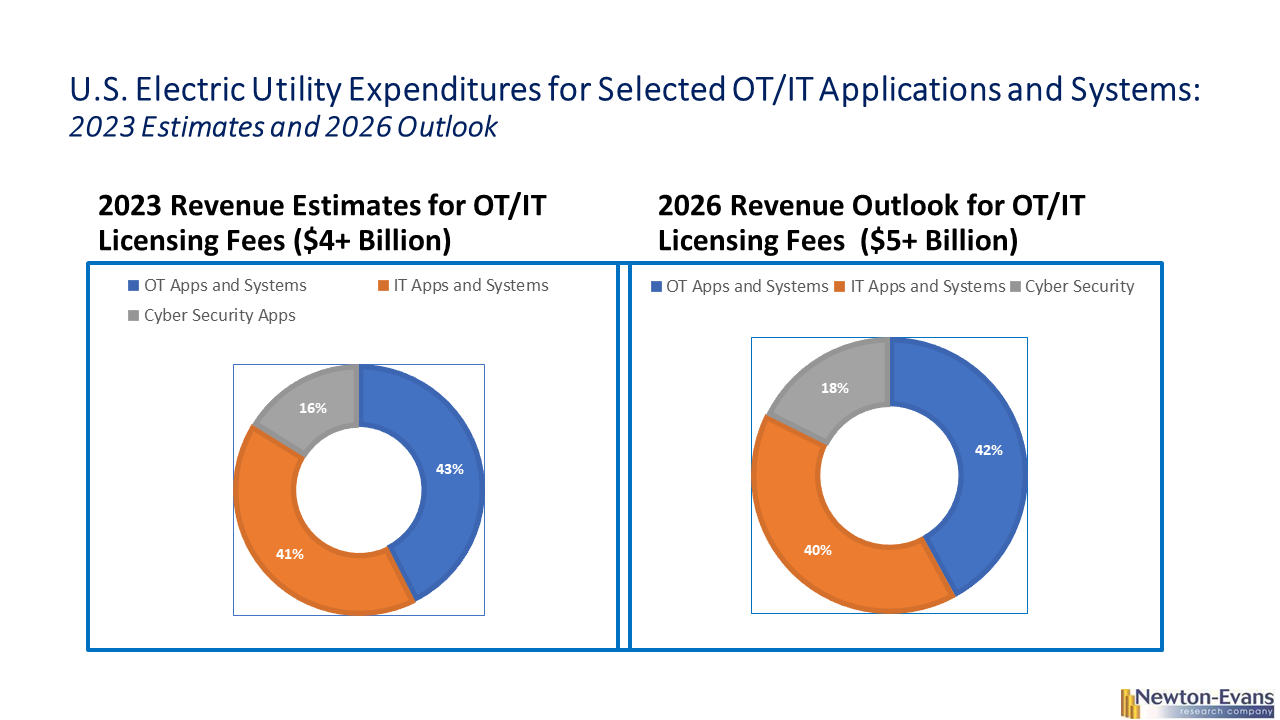
Substation Automation Platforms: A substation automation platform is a substation-resident computing platform that includes some sort of hardware architecture and a software framework (including application frameworks) that may better classify the platform as a gateway, an automation controller or a data concentrator. A single programmable automation platform can perform an expanding array of communications, automation, control and cyber security functions in the electric utility substation.
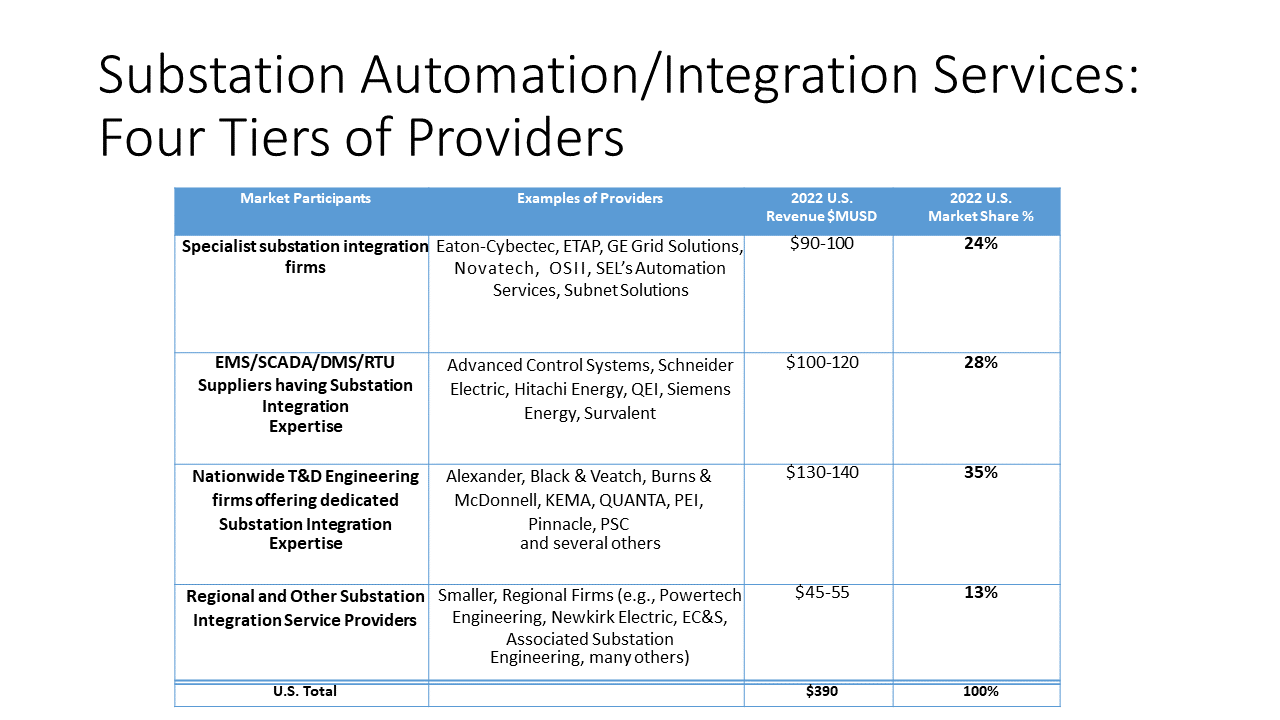
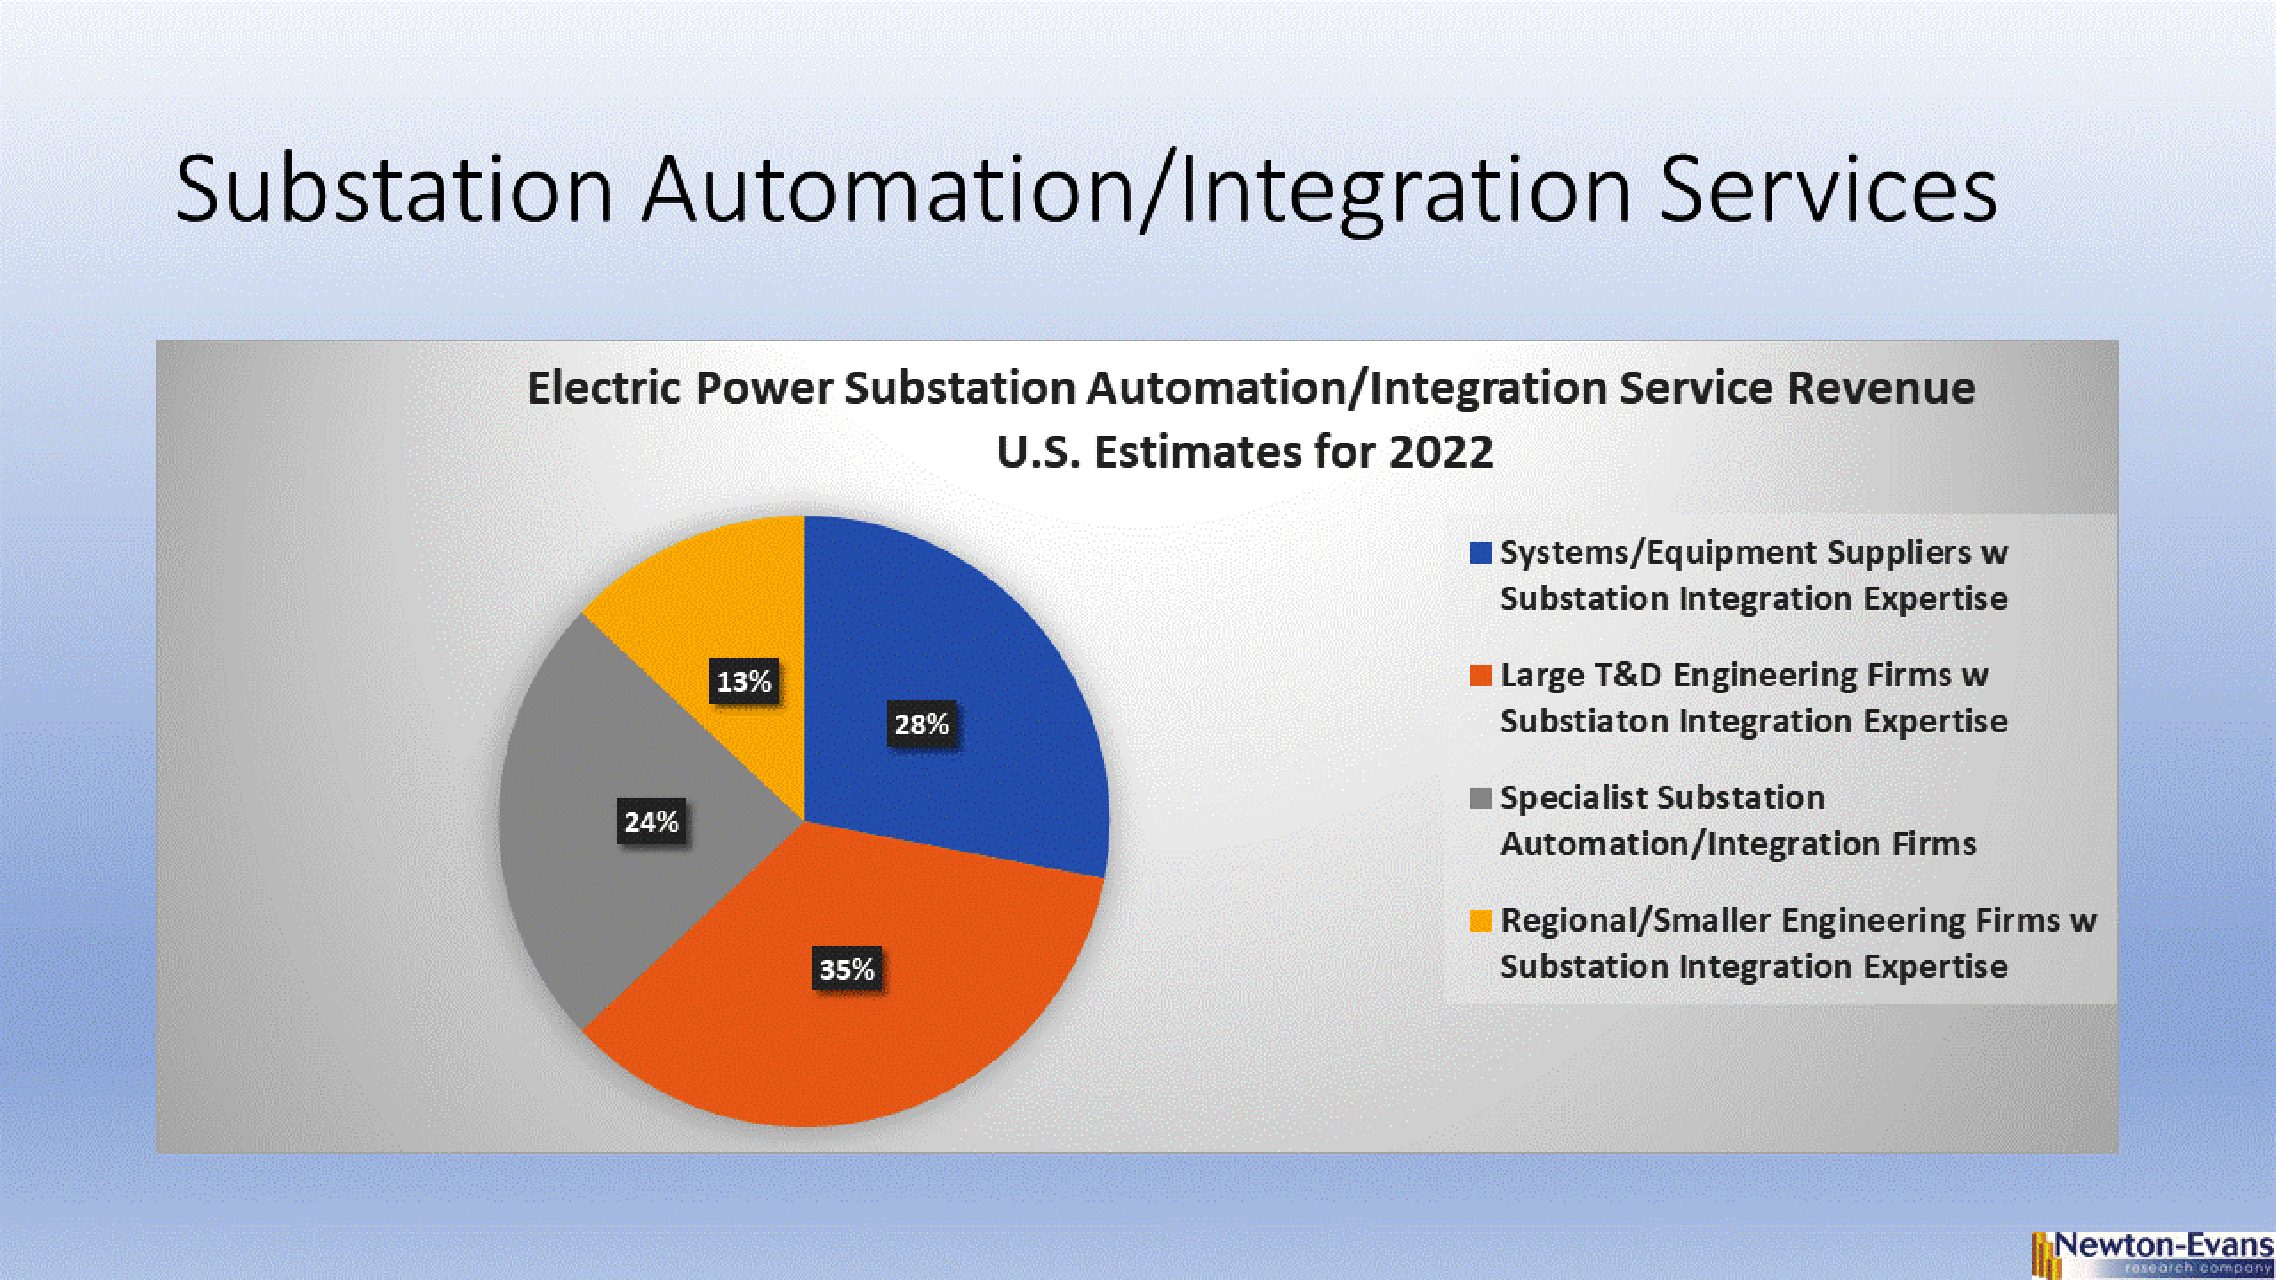
SEL’s RTAC and 2032 units are quite strongly represented as of mid-year 2024, especially in mid- size cooperatives and municipal utilities. Together with NovaTech’s ORION along with Eaton’s Cybectec and GE’s older D400 (now replaced with the G100/G500 offerings) have been long- term participants in development and provision of substation automation platforms. These four firms accounted for nearly three-quarters of the 2023 market. The larger global firms are also active as noted in the table below. Note that substation platform providers may also provide complete substation modernization consulting and engineering services and can provide project management for large automation/modernization projects. Note too that some feature-rich, smart RTU equipment also serve as substation automation platforms. Revenue for these advanced RTUs is not included here. Newton-Evans estimates for substation automation platform sales in 2024 were in the $125-175 million range. SA03 in this series.
Multifunction Meters and Recorders: Substation Multifunction Meters, Panel Meters and Recorders are units that can display substation data locally and/or transmit substation data back via RTU or SS controllers and platforms to SCADA and energy management systems. Panel meter sales had plateaued by the early 2000’s, as the functionality of these meters could by then be duplicated by digital relays. However, due to cyber security issues, operational complexity and visualization issues, panel meters are making somewhat of a comeback and finding their niche support base growing once again. Measurements of energy consumption and power quality are among the key attributes of leading multifunction meters and recorders. Waveform capture, harmonics, and alarm limits are also recorded in advanced multifunction meters and recorders. I/O capabilities are provided in these devices for communicating with SCADA and related energy monitoring systems. Newton-Evans estimates for sales of multifunction meters and recorders 2024 are in the $65-90 million range. See SA04 for more information on meters and recorders.
Substation Inter-Utility Revenue Meters are metering products capable of collecting and storing incoming and outgoing substation power flows by performing various measurements. The devices are sold in the low thousands of units annually. As the role of distributed generation resources increases across the U.S., there will likely be a need for additional inter- utility and DER provider-to-utility revenue meters. See SA05 for more information.
Digital Protective Relays: A digital protective relay uses a microcontroller with software-based protection algorithms for the detection of electrical faults. Such relays are also termed as microprocessor type protective relays. As renewable energy sources grow in importance, the need will grow for system protection and control for solar, wind, and other renewable energy installations. New relay designs or adaptations of existing protective relays will be developed to meet the requirements for thousands of DER applications during the remaining years of the 2020’s. There are opportunities for protective relay managers to work directly with renewable systems developers (such as Pure Power Engineering, Trimark, among several others).
The Hubbell acquisitions of RFL Electric just a few years ago, and more recently, the company’s acquisition of Beckwith Electric are harbingers of additional acquisitions of existing smaller independent relay manufacturers likely to occur over the mid-term. These will likely include international manufacturers in the mix. See report SA06 for more information.
Digital Fault Recorders: A digital fault recorder is a microprocessor device level module installed within the substation (or industrial location) that records electric power faults. DFRs are more capable than are power disturbance monitors, which also provide some level of information on electric power faults. Disturbance monitoring equipment (DME) tend to be lower-cost and easier to install and use than are DFRs. DME also provide information on several power fault components and can be used for some root cause analyses. Special purpose, dedicated DFR units tend to have performance features and capabilities that go beyond the increasingly popular relay-centric approach to fault recording. This portion of the DFR market was about $30-$40 million as of 2021. Relays are increasingly being used to provide basic fault recording and sequence of events recording functions as a lower-cost alternative for fully-featured DFRs from the leading U.S. providers. Perhaps $15-25 million of relays applied to this function.
Newton-Evans believes that there will be some level of growth in use of dedicated DFR technology due to the continued deployment of synchrophasor technology across the United States. As well, the increasing demands from regulatory authorities for precise electric power fault information and root cause analysis will affect the increase in use of DFRs and related equipment (including IEEE 1588-compliant clocks). See report SA07 for more information.
Be sure to check in with our site next month for coverage of another seven components of modern digital substations.


 summary reviews and highlights from completed studies